![]() Figure 10 of
Mader, Mol Vis 2006;
12:915-930.
Figure 10 of
Mader, Mol Vis 2006;
12:915-930.
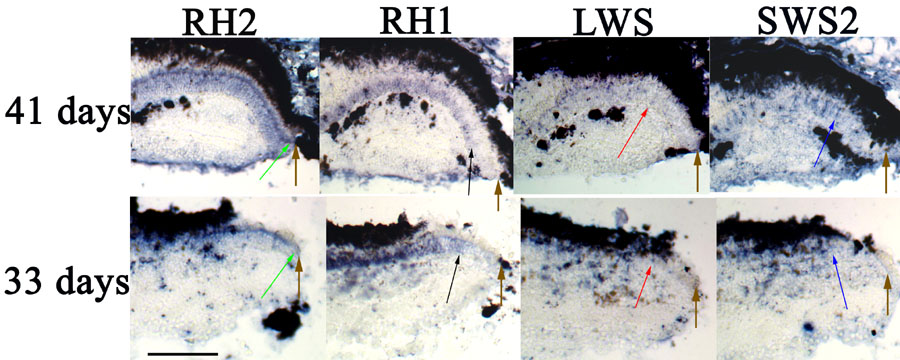
Figure 10. Opsin expression at lesion edges in hypothyroidic postmetamorphic flounder retina
Sections were collected sequentially from retinas exposed to TU for either 41 or 33 days, as indicated; the screened opsin is indicated at the top of each column. In each panel the termination of the ONL at the lesion edge, which corresponds to a location of proliferative, regenerative precursors (Figure 6) [32] is indicated by a brown arrow. The RH2-, RH1-, LWS-, and SWS2-expressing cells closest to the brown arrows are indicated by the green, black, red, and blue arrows, respectively. Note in both examples that RH2-expressing cells are located much closer to the cytogenic region than the other photoreceptors, as indicated by the close proximity of the green and brown arrows (Figure 9D-F). Scale bars represent 100 μm.