![]() Figure 5 of
Cameron, Mol Vis 2005;
11:775-791.
Figure 5 of
Cameron, Mol Vis 2005;
11:775-791.
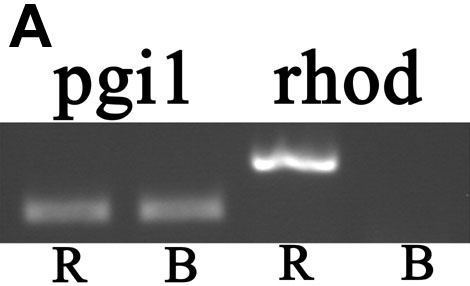
Figure 5. RT-PCR confirmation of tissue-specificity
A: Gel electrophoresis analysis of PCR-amplified, partial-length sequences encoding pgi1 and rhodopsin (rhod). cDNA sample amounts were equivalent across brain (B) and retina (R). The amount of amplified pgi1 product is similar between brain and retina, amplified rhodopsin product is restricted to the retinal sample, and the relative abundance of rhodopsin compared to pgi1 are all consistent with the DNA microarray data (Figure 1, Figure 3). B: Melt curve analysis of the PCR-amplified products shown above. The solid and dotted lines indicate products derived from retinal and brain cDNA, respectively, with green indicating rhodopsin and black indicating pgi1. The melt curve for retina-derived rhodopsin is significantly different from the corresponding melt curve for brain. The latter represents nonspecific amplification products, and is not significantly different from the melt curves observed in the absence of cDNA (data not shown).