![]() Figure 3 of
Cameron, Mol Vis 2005;
11:775-791.
Figure 3 of
Cameron, Mol Vis 2005;
11:775-791.
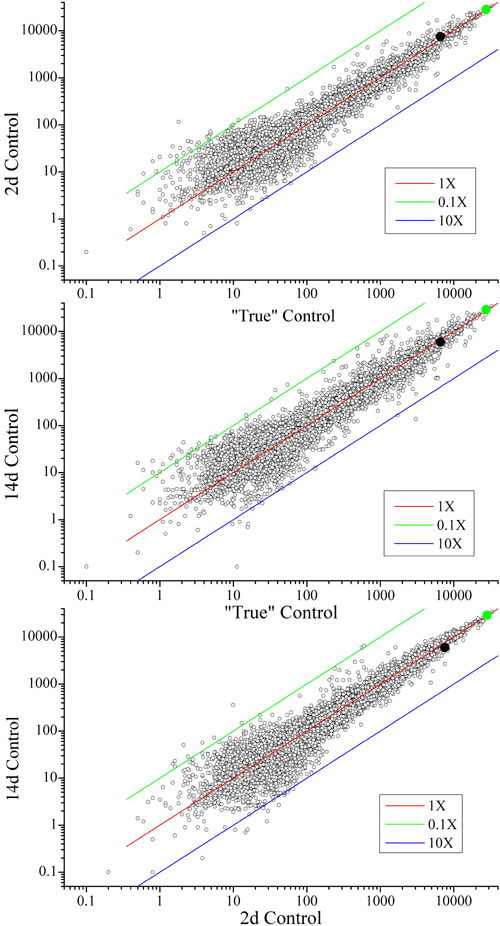
Figure 3. Reliability of the DNA microarray technique
The plotted data, lines, and symbols are the same as in Figure 1. The gene expression profiles of three categories of control retina utilized in this study (true control, 2 d post-lesion control, and 14 d post-lesion control) are plotted with respect to each other. The cross-sample concentration of points near the red line in each plot indicates cross-sample similarity in the individual gene expression levels (compare to Figure 1). Transcripts encoding rhodopsin (green circles) and pgi1 (black circles) are indicated.
