![]() Figure 10 of
Robinson, Mol Vis 2005;
11:1211-1219.
Figure 10 of
Robinson, Mol Vis 2005;
11:1211-1219.
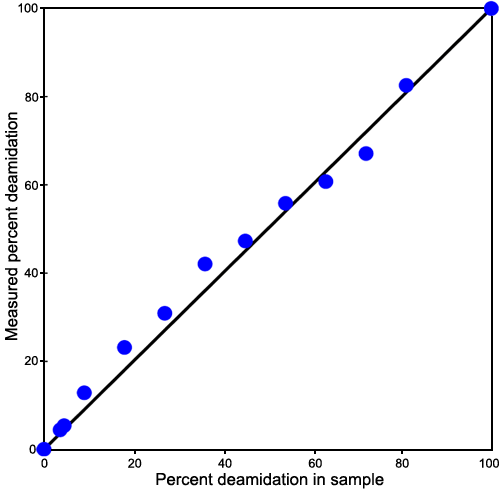
Figure 10. Detection-efficiency-corrected plot of the expected and measured deamidation percentages for collision fragmentation
Plot of the expected and measured deamidation percentages for collision fragmentation, mass defect measurements using the second procedure and with an applied correction for the nonlinearity observed in Figure 9. This correction was calculated by means of the isotopic peak ratios of the measured isotopic peaks in these same spectra. As illustrated in Figure 7, the mass defect peaks are resolved from the isotopic peaks. Since the theoretical ratios of the isotopic peaks are known and these peaks vary in magnitude, a correction curve for ion abundance can be calculated from them. A plot is made of the ratio of actual isotopic abundances to the observed isotopic abundances as a function of peak sizes. This provides a correction factor by means of an internal standard with which to correct the nonlinear ion response.
