![]() Figure 9 of
Robinson, Mol Vis 2005;
11:1211-1219.
Figure 9 of
Robinson, Mol Vis 2005;
11:1211-1219.
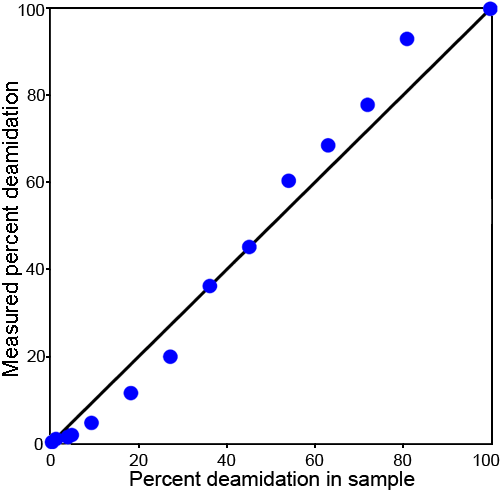
Figure 9. Plot of the expected and measured deamidation percentages for collision fragmentation
Plot of the expected and measured deamidation percentages for collision fragmentation, mass defect measurements using the second procedure. The blue circles identify the 14 residue PGYRGLQ/E162YLLEKGD fragment. These measurements also show the sigmoidal characteristic seen in Figure 8.
