![]() Figure 8 of
Robinson, Mol Vis 2005;
11:1211-1219.
Figure 8 of
Robinson, Mol Vis 2005;
11:1211-1219.
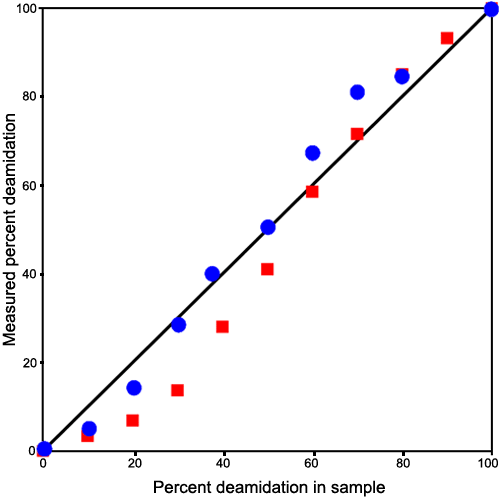
Figure 8. Plot of the expected and measured deamidation percentages for laser fragmentation
Plot of the expected and measured deamidation percentages for laser fragmentation, mass defect measurements using the first procedure. The red squares identify the 18 residue PGYRGLQ/E162YLLEKGDYKDS fragments and the blue circles identify the 14 residue PGYRGLQ/E162YLLEKGD fragments. These values exhibit a sigmoidal character that arises from nonlinearity in quantitative response of ion detection in the ion cyclotron resonance cell. Ions present in lower quantities are detected with lower efficiencies. In quantitative use, this effect can be corrected with a standard curve measured for the instrument and settings used. Alternatively, a correction can be made as is illustrated in Figure 10.
