![]() Figure 4 of
Bright, Mol Vis 2005;
11:1141-1150.
Figure 4 of
Bright, Mol Vis 2005;
11:1141-1150.
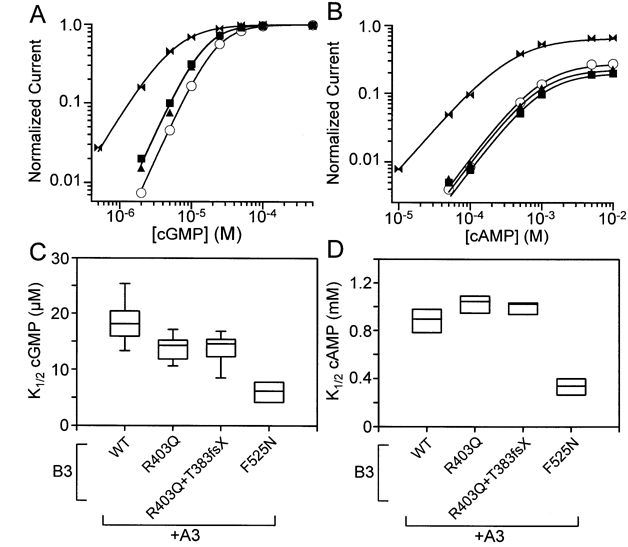
Figure 4. CNGB3 mutations alter apparent ligand affinity
A: Representative dose-response relationships are shown for channel activation by cGMP at +80 mV. Each current measurement is normalized to the maximum current in a saturating concentration of cGMP for that patch. Continuous curves represent fits of the dose-response relation to the Hill equation. For wild-type A3+B3 channels (open circles), K1/2=22.3 μM and n=2. For A3+B3R403Q channels (closed triangles), K1/2=15.3 and n=2. For A3+B3R403Q+B3T383fsX channels (closed squares), K1/2=15.1 μM and n=2. For A3+B3F525N channels (closed bows), K1/2=5.8 μM and n=1.5. B: Representative dose-response relationships are shown for channel activation by cAMP at +80 mV. Currents were normalized to the maximum current in saturating cGMP for that patch. Continuous curves represent fits of the dose-response relation to the Hill equation. For wild-type heteromeric channels (open circles), Imax=0.274, K1/2=970 μM and n=1.4. For A3+B3R403Q channels (closed triangles), Imax=0.225, K1/2=940 μM and n=1.4. For A3+B3R403Q+B3T383fsX channels (closed squares), Imax=0.198, K1/2=1000 μM and n=1.4. For A3+B3F525N channels (closed bows), Imax=0.650, K1/2=400 μM and n=1.2. C: Box plots are shown of the K1/2 for cGMP. All three mutant groups were significantly reduced relative to wild-type channels (p<0.05 and N=7 to 16). However, the F525N group was also significantly lower than the other mutant groups for this parameter (p<0.05). D: Box plots are shown of the K1/2 for cAMP. Compared to wild-type heteromeric channels, the A3+B3R403Q group (N=8) significantly increased this parameter (p=0.023), while the A3+B3F525N group (N=6) significantly reduced it (p<0.001). Symbols in the box plots are described in the legend to Figure 2.