![]() Figure 3 of
Bright, Mol Vis 2005;
11:1141-1150.
Figure 3 of
Bright, Mol Vis 2005;
11:1141-1150.
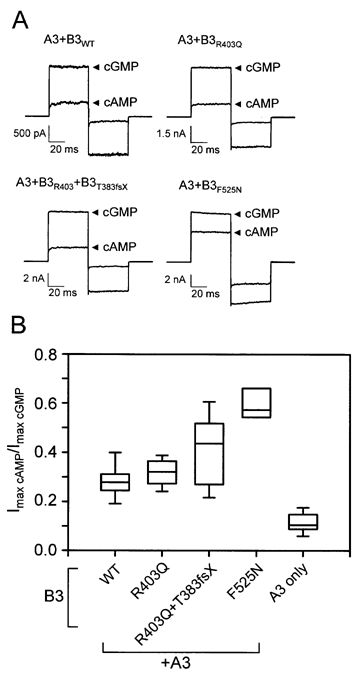
Figure 3. Impact of CNGB3 mutations on partial agonist efficacy
A: Current traces are shown for activation by saturating concentrations of cAMP (10 mM), or cGMP (1 mM). Traces were elicited by the voltage protocol previously described in the legend to Figure 2. B: Box plots are shown of the ratio of currents elicited by saturating concentrations of cAMP and cGMP at +80 mV for homomeric (N=10) and heteromeric (N=17) wild-type channels and mutant heteromeric channels (N=7 to 16). The symbols are described in the Figure 2 legend. All heteromeric groups were significantly different from the wild type homomeric group. Only the F525N group was significantly different from the wild-type heteromeric group (p<0.001).
