![]() Figure 3 of
Vazquez-Chona, Mol Vis 2005;
11:958-970.
Figure 3 of
Vazquez-Chona, Mol Vis 2005;
11:958-970.
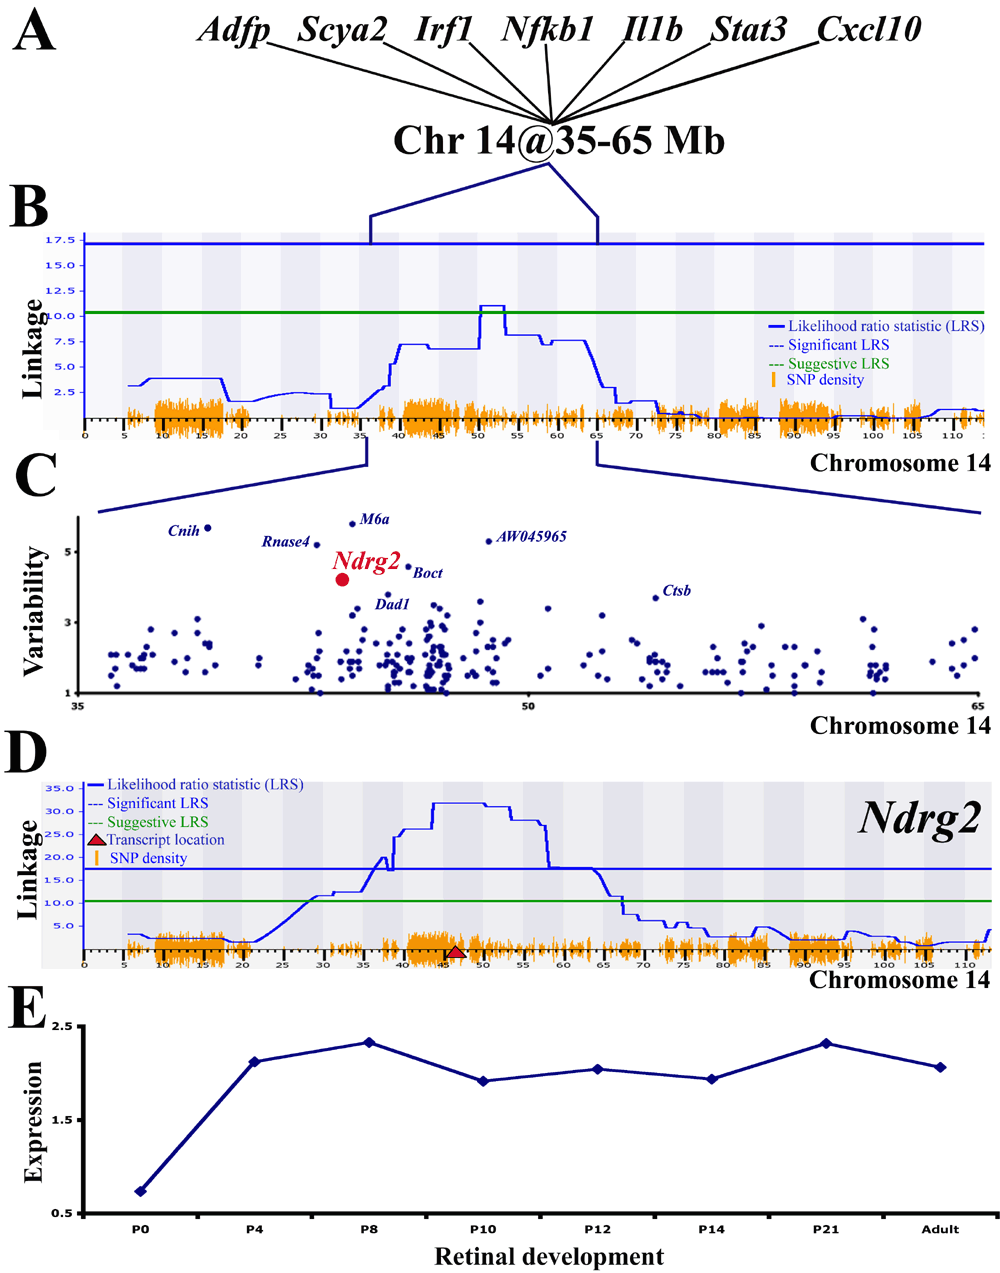
Figure 3. Evaluating candidate genes within Chromosome 14 locus
A: The transcript variability of Adfp, Scya2, Irf1, Nfkb1, Il1b, Stat3, and Cxcl10 in brains from BXD RI mouse strains is genetically linked to a regulatory locus on Chromosome 14. This network was generated by comparing genome-wide scans that measure the linkage of transcript variability across the mouse genome, as described in Figure 1. These transcripts are also upregulated as acute phase transcripts in retina, brain and spinal cord (Table 2). Transcripts genetically linked to the same regulatory loci and highly regulated in injured CNS are hypothesized to be part of a genetic network. B: The combined genome-wide map shows that their transcript expression has a strong genetic linkage to a locus within Chromosome 14. The genome wide scan, zoomed at Chromosome 14, shows the genetic linkage (y-axis, likelihood ratio statistic [LRS]) across the chromosome (x-axis, Megabase pairs [Mb]). The locus (35 to 65 Mb) includes 315 genes, some of which have a high or low single nucleotide polymorphism (SNP) density. SNP density is denoted by the height of the orange lines on the x-axis. Several rules may help in selecting candidate gene responsible for this regulatory locus. The first rule is there have to be SNPs present within the coding or regulatory region of the gene of interest. As a first approximation we used SNP density that is displayed at the bottom of panel B and D. The second rule is a high degree of transcript abundance variability in the BXD RI strains (illustrated in C). C: Transcript abundance variability in normal forebrains of BXD RI mouse strains is due to genetic polymorphisms between the parental C57BL/6 and DBA/2J mouse strains. The graph illustrates transcript abundance variability (y-axis) for genes (dots) within the 35 to 65 Mb interval of Chromosome 14 (x-axis). For a transcript to be mapped its abundance must vary across the BXD RI mouse strains. The higher the variation in transcript abundance the more likely that the gene is a candidate. Furthermore we expect that the variability is due to a polymorphism in the candidate gene, suggesting that the polymorphic gene is modulating its own expression level (that is, a "cis-regulatory locus"). We measured transcript variability using an analysis of variance (ANOVA) that tests the between-strain variance compared with the total variance for 100 arrays from 35 mouse strains. The degrees of freedom for the between-group and total variance are 34 and 99. Strain-specific variation is significant (p<0.05) when F34,99>1.5. In the graph, each dot represents a gene with its variability measured by the ANOVA F-statistic (y-axis) and its genomic location within Chromosome 14 described in Mb. Rnase4, AW045965, M6a, Boct, Dad1, Ctsb, Cnih, and Ndrg2 are polymorphic genes that displayed significant transcript variability and cis-regulatory loci in normal forebrains of BXD mouse strains. D: The third criterion identifies the genes that display self regulation across CNS tissues. For example, the transcript variability of Ndrg2 (red circle in C) displayed a cis-regulatory locus in brain (LRS=38, probe set 96088_at) and cerebellum (LRS=13, probe set 1448154_at_A) of BXD RI mouse strains. Here we illustrate linkage of Ndrg2 transcript variability in BXD RI mouse strains across Chromosome 14. Red triangle indicates gene location. Rnase4, AW045965, and M6a also displayed cis-regulatory loci in brain and cerebellum (data available at GeneNetwork). E: The fourth criterion deals with the biology of the system. Meta-analyses of transcript levels during retinal development and retinal injury can help determine if a candidate gene is a potential regulator in the retina. For example in murine models of retinal development, Ndrg2 displayed moderate transcript levels as early as postnatal day 4 and was highly expressed in the adult retina. In contrast, Rnase4, AW045965, and M6a were absent from birth through adult stages. Normalized expression data for Ndrg2 (y-axis) during murine retinal development (x-axis) is available at RetDevGE [21].
