![]() Figure 1 of
Vazquez-Chona, Mol Vis 2005;
11:958-970.
Figure 1 of
Vazquez-Chona, Mol Vis 2005;
11:958-970.
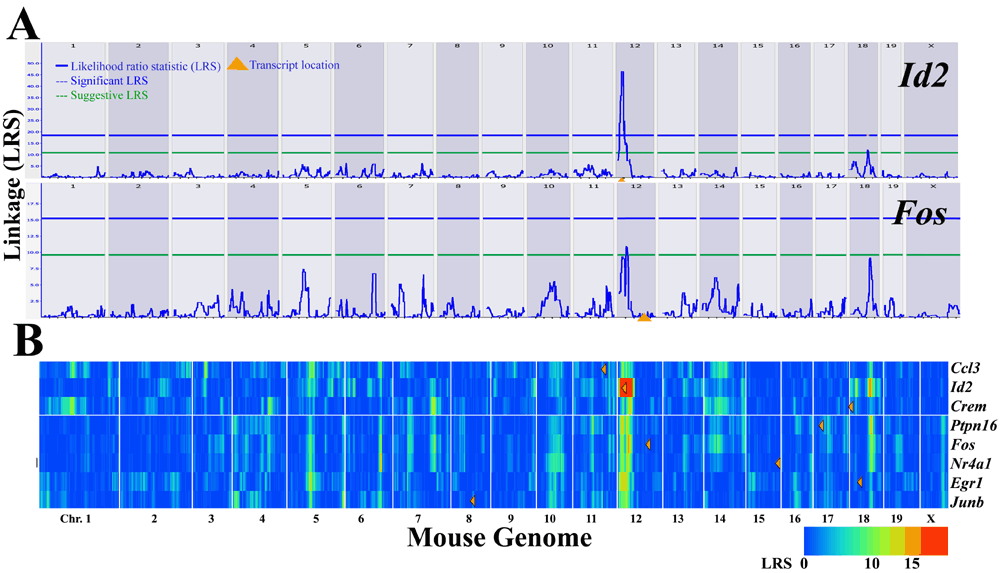
Figure 1. Acute phase genes are modulated by distinct regulatory loci
We used the genetic analysis of transcript expression at GeneNetwork to define genomic loci that control transcript abundance variability in mouse brains. At the heart of this analysis is a unique population of mice, the recombinant inbred (RI) strains of mice. One group of mice were derived by inbreeding for over 20 generations the F1 crosses between C57BL/6 and DBA/2J mouse strains. Each BXD RI strain has a shuffled genome consisting of a unique recombination of the C57BL/6 and DBA/2J genomes, forming a segregating population of mice. These RI mouse strains, the associated microarray databases, and the genetic-analysis tools at GeneNetwork allow one to explore regulatory loci and networks built around any transcript [9-12]. The best way to think about the genetic linkage mapping is at the transcript level. If there is specific variability in transcript abundance among members of a segregating population, then it is possible to map transcript abundance to a specific chromosomal locus. Genetic linkage maps show that a group of acute phase genes is controlled by a regulatory locus on Chromosome 12. A: Individual genome-wide maps for Id2 and Fos display linkage of transcript variability (y-axis) to loci across the mouse genome (x-axis). Genetic analysis of transcript data from brain tissue was determined in a panel of BXD recombinant inbred (RI) mouse strains [9,11]. Maps were generated by linking transcript variability against 779 genetic markers that are interspaced along the mouse genome by an average of 4 Megabase pairs (Mb). The alternating white and blue columns represent chromosomes. The linkage between transcript variation and genetic differences at a particular genetic locus is measured in terms of likelihood ratio statistic (LRS; solid blue line). Dashed horizontal lines mark transcript-specific significance thresholds for genome-wide p<0.05 (significant, blue) and genome-wide p<0.63 (suggestive, green). Orange triangle indicates gene location. B: Multiple parallel genome-wide maps display linkage using color hues with yellow and red bands representing suggestive and significant LRS. A common regulatory locus on Chromosome 12 is identified for selected acute phase genes. Within this locus, there is a genomic element modulating the expression of acute phase genes such as Fos, Junb, and Egr1. Individual and multiple genome-wide maps were generated using the tools at GeneNetwork. Orange triangles indicate gene location. Linkage maps were generated using the Interval Mapping and Cluster Tree tools at GeneNetwork (UTHSC Brain mRNA U74Av2 HWT1PM; December 2003).
