![]() Figure 4 of
Rundle, Mol Vis 2004;
10:177-185.
Figure 4 of
Rundle, Mol Vis 2004;
10:177-185.
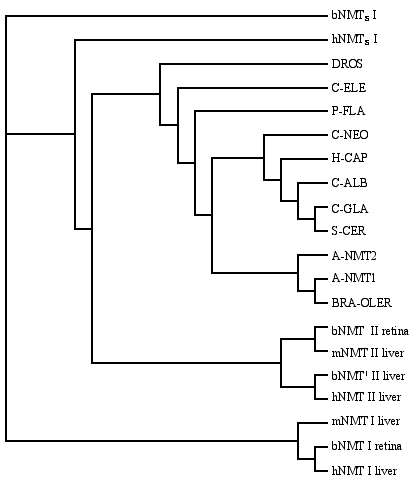
Figure 4. Phylogenetic analysis of NMT sequences from various species
The tree was constructed by the neighbor joining method based on sequence data from the following references [8,9,29-31] and bovine sequences shown in Figure 1 and Figure 3. Identifiers in the figure are constructed from the following abbreviations: "b" for bovine, "h" for human, "m" for mouse, "A" for Arabadopsis thalania, "DROS" for Drosophila melanogaster, "C-ELE" for C. elegans, "P-FLA" for Plasodium falciparum, "C-NEO" for Cryptococcus neoformans, "H-CAP" for Histplasma capsulatum, "C-ALB" for Candida albicans, "C-GLA" for Candida glabrata, "S-CER" for S. cerevisiae, and "BRA-OLER" for Brassica oleracea.
