![]() Figure 2 of
Ohngemach, Mol Vis 2004;
10:1019-1027.
Figure 2 of
Ohngemach, Mol Vis 2004;
10:1019-1027.
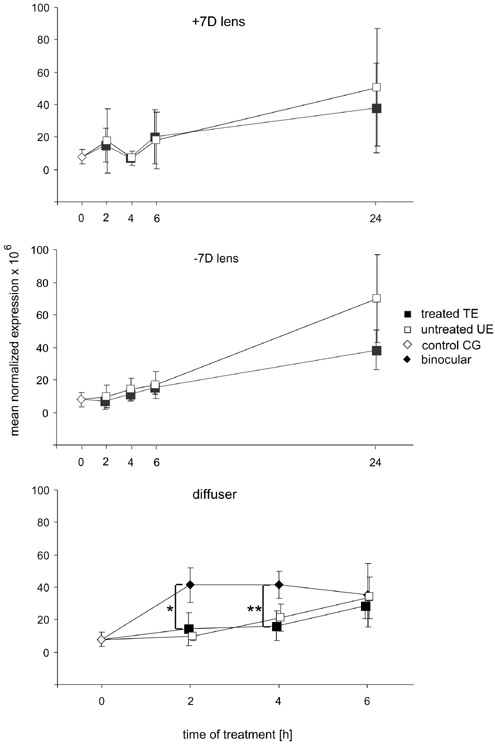
Figure 2. Selenoprotein expression following defocus and deprivation
The time course of selenoprotein P mRNA expression changes in chicken retina, induced by imposed positive or negative defocus, or image degradation by diffusers is shown in this figure. Error bars represent standard deviations. The symbols for treated (TE) and untreated (UE) mean normalized expression (MNE) refer to monocularly treated animals. For the MNE of the control group (CG) and the group treated binocularly with a diffuser (binocular), the mRNA expression in both eyes of an animal was analysed. Five to seven animals were tested in each treatment group. Statistically significant differences between the control group and the various treatment groups were detected by ANOVA, the results of which are listed in Table 4. Significant differences (after Bonferroni correction) at a given time point between treated and contralateral untreated eyes, or eyes that were treated with monocular and binocular diffusers, were determined by paired or unpaired t-test and are shown in the figure. Asterisks indicate different levels of statistical significance (* for p<0.05, ** for p<0.01, *** for p<0.001).
