![]() Figure 5 of
Heys, Mol Vis 2004;
10:956-963.
Figure 5 of
Heys, Mol Vis 2004;
10:956-963.
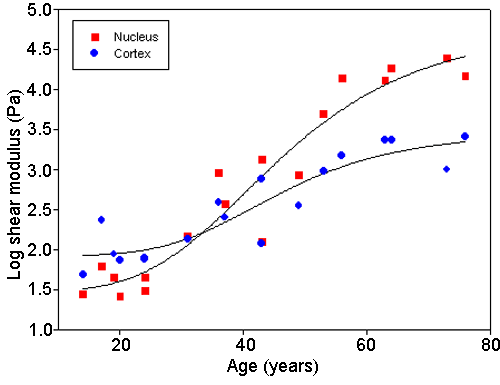
Figure 5. Stiffness values of cortex and nucleus as a function of lens age
Nuclear and cortical shear modulus values plotted on a log scale as a function of age for individual lenses. Nuclear values are shown in blue and cortical values in red. The curves were fitted using SigmaPlot (Systat Software Inc., Richmond, CA), these curves were nonlinear regressions using a Hill 4 parameter sigmoidal function:
For the curve of nuclear data, R2=0.9215 with standard error of mean=0.3436. For the curve of cortical data, R2=0.8364 with standard error of mean=0.2617. Mean and standard errors of coefficients are listed in Table 1.