![]() Figure 4 of
Haque, Mol Vis 2003;
9:52-59.
Figure 4 of
Haque, Mol Vis 2003;
9:52-59.
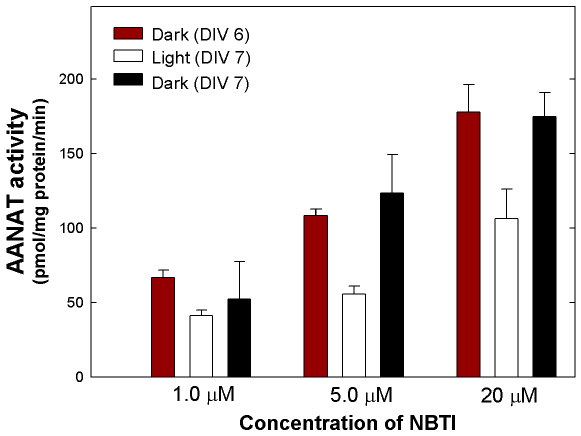
Figure 4. Concentration-response analysis of the effect of NBTI on daily rhythm of AANAT activity
Cultures were prepared from embryonic day 6 retinas and incubated as described in the legend to Figure 1, with complete replacement of the culture medium on DIV 4, except that the concentration of NBTI added on DIV 1 and 4 was varied. Cells were harvested on the night of DIV 6 at ZT 18 and on DIV 7 at ZT 10 and ZT 18. Data are shown as means with the error bars representing the SEM (N=3-4). Significant diurnal fluctuations of AANAT activity were observed in cells incubated with 5 μM NBTI (p=0.030) and 20 μM NBTI (p=0.036), but not with 1 μM NBTI (p=0.661).
