![]() Figure 4 of
Liljekvist-Larsson, Mol Vis 2003;
9:657-664.
Figure 4 of
Liljekvist-Larsson, Mol Vis 2003;
9:657-664.
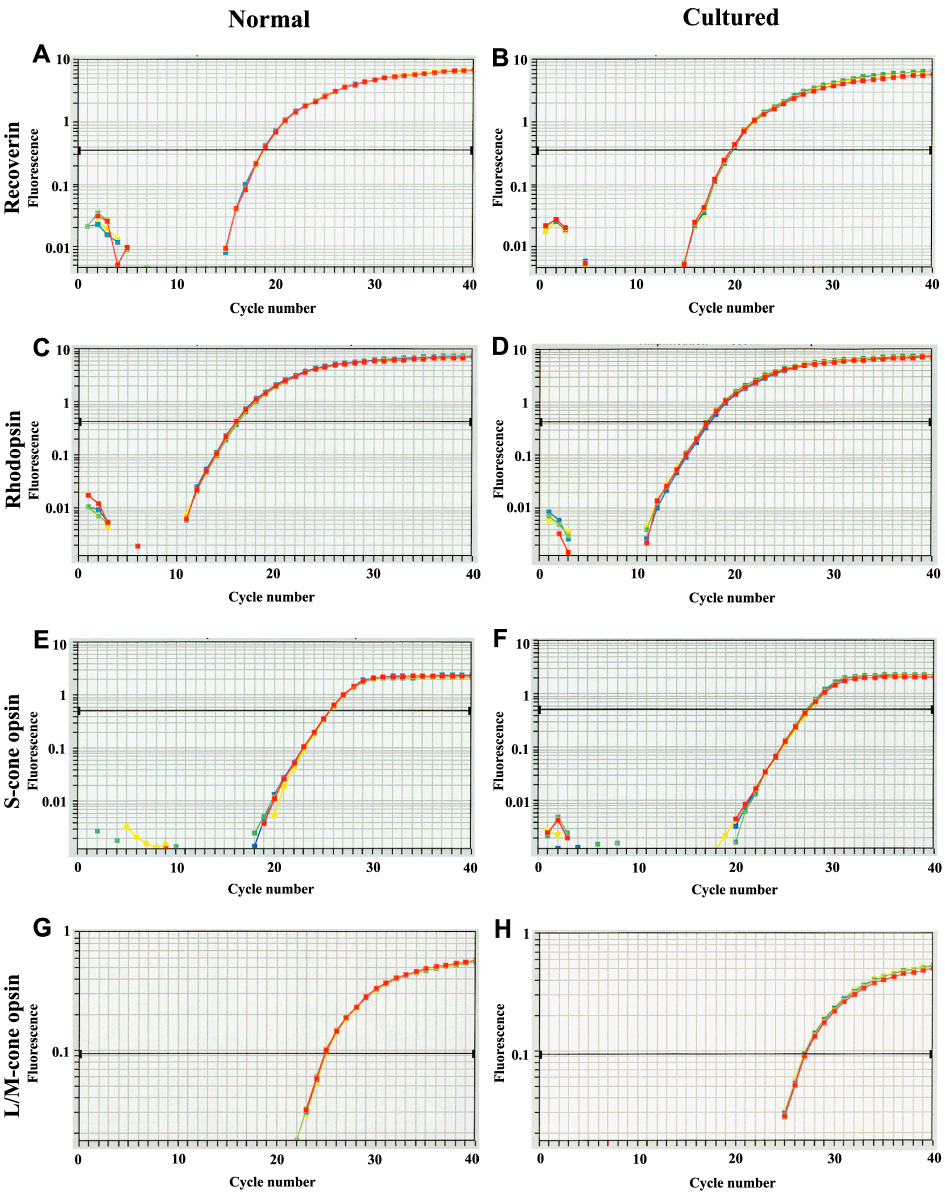
Figure 4. Accumulation of RT-PCR products
Representative accumulation curves showing the increase of SYBR green fluorescence with increasing cycle number, for the targets recoverin (A,B), rhodopsin (C,D), S-opsin (E,F) and M/L-opsin (G,H) in cultured and control retinas are presented. SYBR green fluorescence is shown on a logarithmic scale.