![]() Figure 6 of
Qaddoumi, Mol Vis 2003;
9:559-568.
Figure 6 of
Qaddoumi, Mol Vis 2003;
9:559-568.
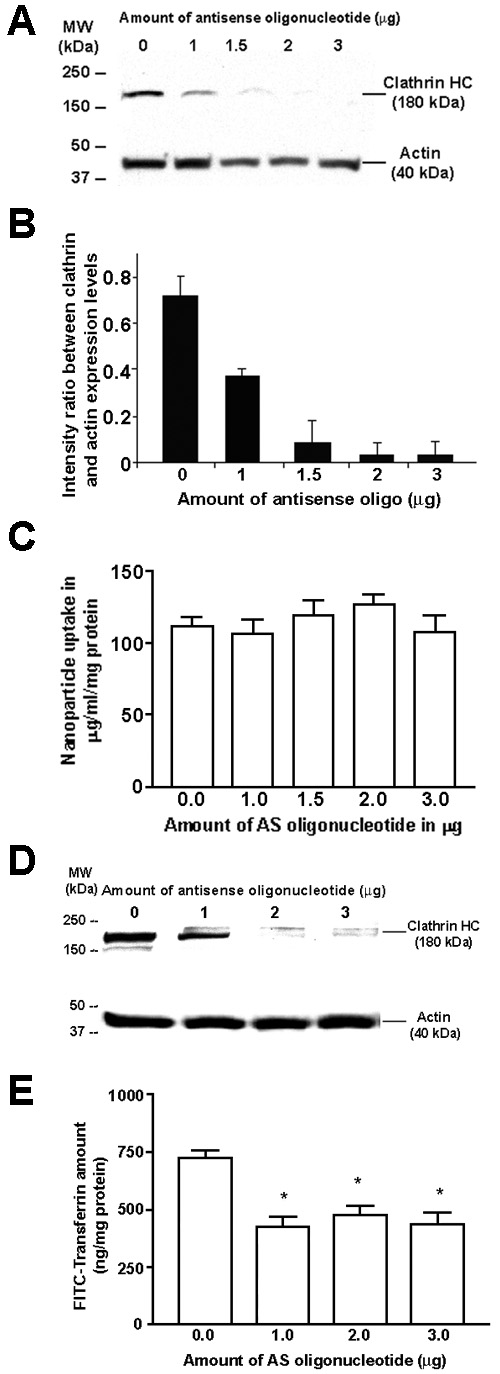
Figure 6. Knockdown of clathrin HC protein expression
A: Western blot analysis of RCEC lysate following 24 h transfection using Lipofectamine reagent (10 μg/ml) with various concentrations of antisense oligonucleotides targeted against clathrin HC mRNA. Western blot analysis of actin protein expression in the same RCEC lysate was performed as a positive control for antisense oligonucleotide specificity against clathrin HC. Figure 6A represents one typical western blot (n=1). For antisense sequence and source, see methods section. B: Quantitative analysis of clathrin expression normalized against actin protein expression as a function of increasing doses of antisense oligonucleotides in μg. Images and bands were scanned and quantified using Scion Image software and indicated as percent inhibition with respect to clathrin HC levels in untreated samples (mock transfection). Bars represent mean±standard error of the mean (n=4). C: Apical uptake of PLGA nanoparticles (0.5 mg/ml) in RCECs at 37 °C for 30 min following 24 h transfection with antisense oligonucleotides against clathrin HC. Bars represent mean±standard error of the mean (n=4). D: Western blot similar to A above, but with different concentrations of antisense oligonucleotide. E: Basolateral uptake of FITC-transferrin (50 μg/ml) in RCECs at 37 °C for 30 min following 24 h transfection with antisense oligonucleotides against clathrin HC. Bars represent mean±standard error of the mean (n=4). The asterisk denotes significant differences from control (zero antisense oligonucleotide concentration, p<0.01).