![]() Figure 1 of
Ruotolo, Mol Vis 2003;
9:538-548.
Figure 1 of
Ruotolo, Mol Vis 2003;
9:538-548.
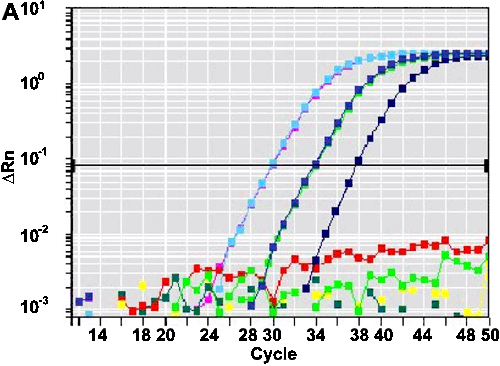
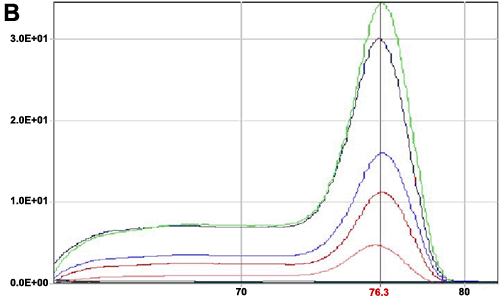
Figure 1. Typical Real-time PCR data
The amplification curves for presenilin 1, obtained with three 10-fold serial dilutions of a cataractous lens-derived cDNA (A), and the corresponding melting curves (B) are shown. An 80 bp-long amplicon was produced (see Table 2 and Material and Methods for details on Real-Time PCR analysis).

