![]() Figure 6 of
Hawse, Mol Vis 2003;
9:515-537.
Figure 6 of
Hawse, Mol Vis 2003;
9:515-537.
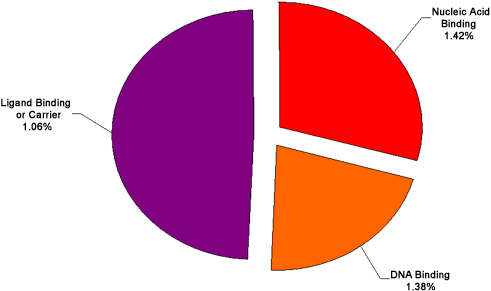
Figure 6. Functional cluster analysis of genes involved in molecular functions which have increased expression levels in cataract versus clear lenses
Functional cluster analysis of genes involved in molecular functions which have increased expression levels in cataract versus clear lenses. The specific sub-categories of genes determined to be significantly altered using the statistical clustering program, EASE, are indicated. Percentages indicate the number of altered genes in each sub-category relative to their total representation on the microarray. Colors denote the approximate relative cellular location for which the genes in each sub-category function ranging from the nucleus to the plasma membrane (red to violet). Individual genes in each category are listed in Table 4. Pie piece size approximates the number of changed genes in each sub-category.
