![]() Figure 7 of
Rogojina, Mol Vis 2003;
9:482-496.
Figure 7 of
Rogojina, Mol Vis 2003;
9:482-496.
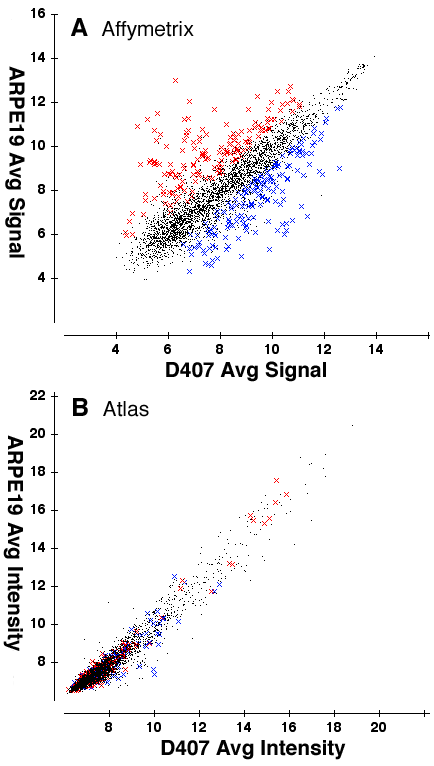
Figure 7. Average significant differences: Affymetrix vs. Atlas Glass
The differential up-regulation or down-regulation between ARPE19 cells and D407 cells on the Affymetrix platform (A) and the Atlas Glass platform (B) were compared to each other. To make a direct comparison between the two platforms, the genes in the average summations of the data were filtered to include only genes in common with both platforms. The genes on the Affymetrix platform (A) were categorized as changed if there was a 1.7 fold difference on the Affymetrix platform and a p value of 0.05. The up-regulated genes are shown in red and the down-regulated genes in blue. Notice the dramatic difference between platforms. For example, genes that were up-regulated on the Affymetrix chip (colored red) appear to be down-regulated on the Atlas Glass platform. The data is scaled as in Figure 1.