![]() Figure 6 of
Rogojina, Mol Vis 2003;
9:482-496.
Figure 6 of
Rogojina, Mol Vis 2003;
9:482-496.
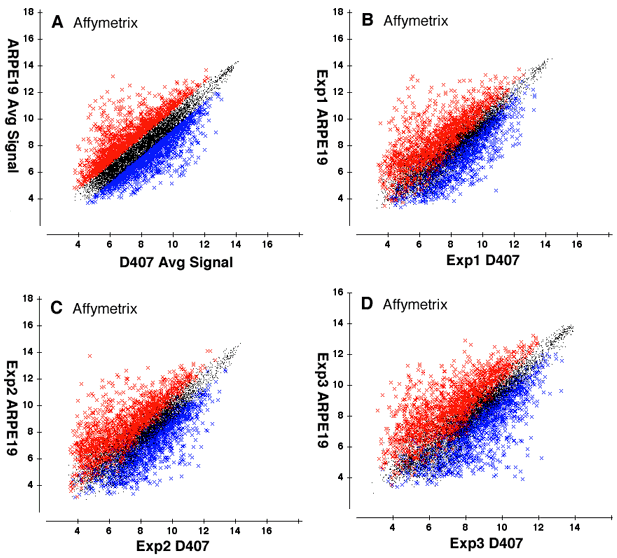
Figure 6. Significant differences on the Affymetrix microarrays
This figure presents a comparison of the D407 cell line and the ARPE19 cell line using the Affymetrix microarray platform, similar to Figure 3. However, in this figure the average of three separate experiments (shown in A) was used to define genes with a 1.7 fold up-regulation (red) and a 1.7 fold down-regulation (blue). The data from the two sets of HG-U95Av2 chips is shown in B and C; while the data from the HG-U133A is in D. All of the data is normalized and scaled to allow for between experiment comparisons. Notice the overall agreement between the distributions of the signal intensities across the different individual experiment. The data is scaled as in Figure 1.
