![]() Figure 4 of
Rogojina, Mol Vis 2003;
9:482-496.
Figure 4 of
Rogojina, Mol Vis 2003;
9:482-496.
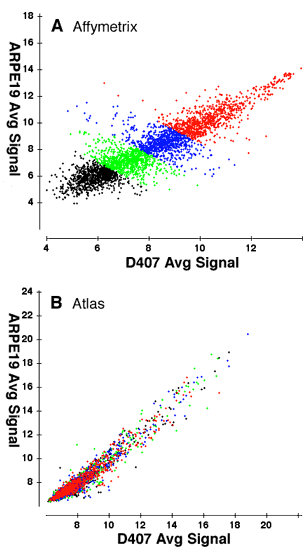
Figure 4. Average signals: Affymetrix vs. Atlas Glass
The differential gene expression between ARPE19 cells and D407 cells on the Affymetrix platform (A) and the Atlas Glass platform (B) were compared. To make a direct comparison between the two platforms, the genes in the average summations of the data were filtered to exclude genes not common to both platforms. The data on the Affymetrix platform (A) was then divided into quartiles and colored. Notice the disconcordance between signal intensities on the Affymetrix platform as compared to those observed on the Atlas Glass platform (B). For example, genes having very high signal intensity on the Affymetrix chip (upper quartile colored red) are spread throughout the distribution on the Atlas Glass platform. The data is scaled as in Figure 1.
