![]() Figure 1 of
Leung, Mol Vis 2003;
9:425-439.
Figure 1 of
Leung, Mol Vis 2003;
9:425-439.
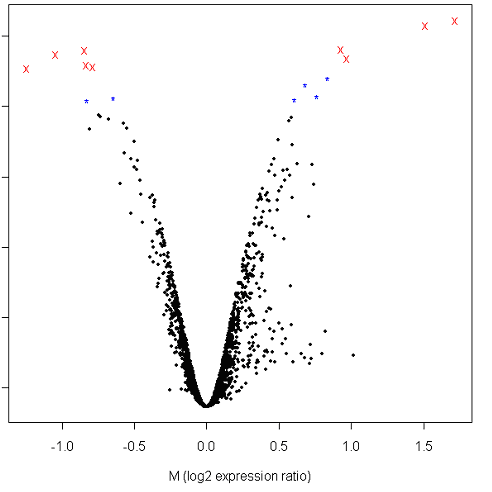
Figure 1. B statistics vs M (log2 expression ratio)
The log posterior odds (B statistics) of every gene to be differentially expressed were plotted against their log2 expression ratio. Higher B statistics means the gene is more likely to be differentially expressed. Positive M means the gene expression level under DEX treatment is higher than control while negative M means it is lower. The genes with asterisk ("*") have B statistics >=2 and <3 while those with cross ("x") have B statistics >=3.
