![]() Figure 1 of
Wride, Mol Vis 2003;
9:360-396.
Figure 1 of
Wride, Mol Vis 2003;
9:360-396.
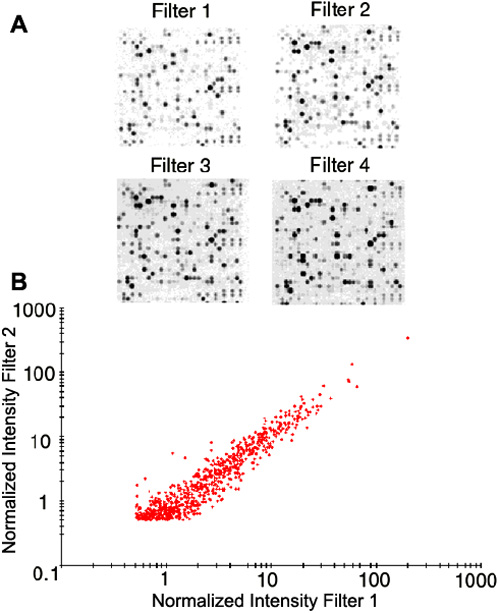
Figure 1. Demonstration that the level of variation between the replicates is minimal
A: Sections of four separate nylon microarray filters stripped and reprobed with 33P labeled newborn lens target RNA. This figure indicates that the level of variation between the replicates is minimal. B: Screen shot from PathwaysTM 3 analysis showing a representative scatter plot of a comparison of spot intensities of newborn lens Filters 1 and 2 (from Figure 1A). The scatter plot indicates that there is a lesser degree of variation of spot intensities at higher intensity values, compared to lower spot intensities. Spots below background (less than a normalized intensity value of 0.505) have been removed as have control mouse genomic spots. A value of 1 represents the mean normalized intensity value of all spots on all arrays imported into the PathwaysTM 3 project.