![]() Figure 2 of
Hedegaard, Mol Vis 2003;
9:355-359.
Figure 2 of
Hedegaard, Mol Vis 2003;
9:355-359.
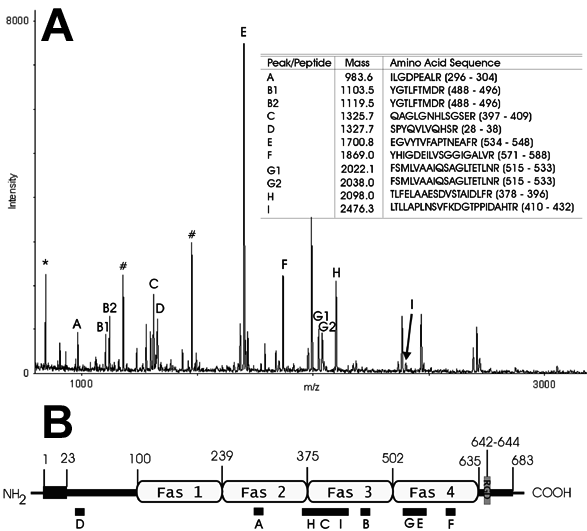
Figure 2. Identification of TGFBIp by MALDI-TOF mass spectrometry
A: Mass spectrum of a tryptic digest of the proteins within area 1 in Figure 1A. The peaks represent different peptide masses. Peaks labeled from A-I correspond to different TGFBIp-peptides. Each TGFBIp-peptide peak is ordered in the table with their respective masses and amino acid sequences were identified by the mass spectrometer. In two instances (peak B and G), two peaks represent the same peptide, due to oxidation of methionine of the peptide. Peptides derived from auto-proteolysis of trypsin are denoted with an asterisk ("*"). The peaks marked with a sharp ("#") indicate contamination (dust) from keratin 1-derived peptides. Peaks that have not been labeled could not be identified. Note that all masses are +1 due to an additional proton taken up by the peptide during the mass spectrometry [19]. B: A schematic representation of TGFBIp (numbers are amino acids). Numbers 1-23 tally to the signal-peptide, where the amino terminus of the secreted TGFBIp starts at amino acid 24. Fas1 to Fas4 are fasciclin I repeats. An RGD-sequence is present in the carboxy terminus comprising amino acids 642 to 644. The black boxes below the TGFBIp representation indicate the nine peptides identified by mass spectrometry.
