![]() Figure 4 of
Zhang, Mol Vis 2003;
9:238-248.
Figure 4 of
Zhang, Mol Vis 2003;
9:238-248.
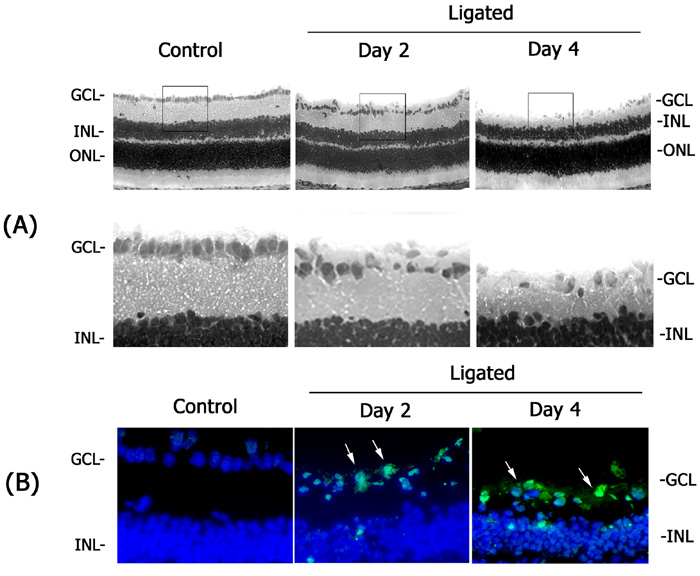
Figure 4. Plasminogen activation leads to ganglion cell loss
A. Tissue morphology was assessed in retinal cryostat sections (10 μm) prepared 2 and 4 days after optic nerve ligation and compared with control retinal sections (n=4). GCL=ganglion cell layer, INL=inner nuclear layer, ONL=outer nuclear layer. Photographs in the lower panel are enlarged images of the area indicated in the upper panel. B. TUNEL assay was performed on retinal cryosections 2 and 4 days after optic nerve ligation and examined by fluorescence microscopy to identify apoptotic cells. Images shown are the overlapping images of TUNEL (green) and Hoechst dye-nuclear staining (Blue). Arrows indicate TUNEL positive cells in ganglion cells. Also note few TUNEL positive cells in the inner nuclear layer at later time periods after optic nerve ligation due to secondary damage. GCL=ganglion cell layer, INL=inner nuclear layer.