![]() Figure 3 of
Zhang, Mol Vis 2003;
9:238-248.
Figure 3 of
Zhang, Mol Vis 2003;
9:238-248.
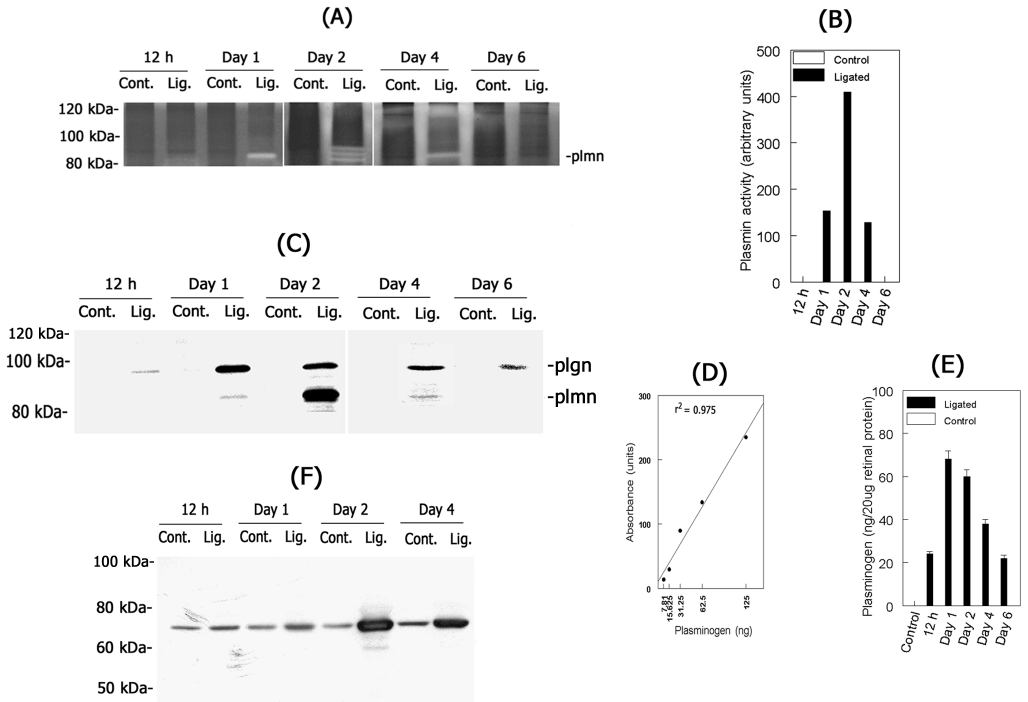
Figure 3. Plasminogen activation in the retina
Retinal extracts were prepared from injured (Lig.) or uninjured control (Cont.) eyes over a time course from 12 h to 6 days after optic nerve ligation (n=4 for each experimental group). A. Aliquots containing equal amounts of protein (25 μg) were subjected to casein zymography. B. The area cleared by plasmin was measured by scanning densitometry and reported as arbitrary units. C. Retinal extracts were subjected to western blot analysis to determine plasminogen and plasmin proteins. Plmn=plasmin, plgn=plasminogen. D. Known amounts of plasminogen standards (7.81, 15.625, 31.25, 62.5, and 125 ng, data not shown) were subjected to western blot analysis to obtain a linear densitometric curve (r2=0.975). E. Amount of plasminogen in retinal extracts was then calculated by comparing to the standard curve. The bars and error bars represent the mean and standar error of the mean, respectively. F. Aliquots containing equal amount of protein (25 μg) from control (Cont.) and optic nerve ligated (Lig.) retinas 12 h, 1 day, 2 day, and 4 day after optic nerve ligation were subjected western blot analysis using antibodies against murine albumin (1:1000 dilution).