![]() Figure 3 of
Darden, Mol Vis 2003;
9:191-199.
Figure 3 of
Darden, Mol Vis 2003;
9:191-199.
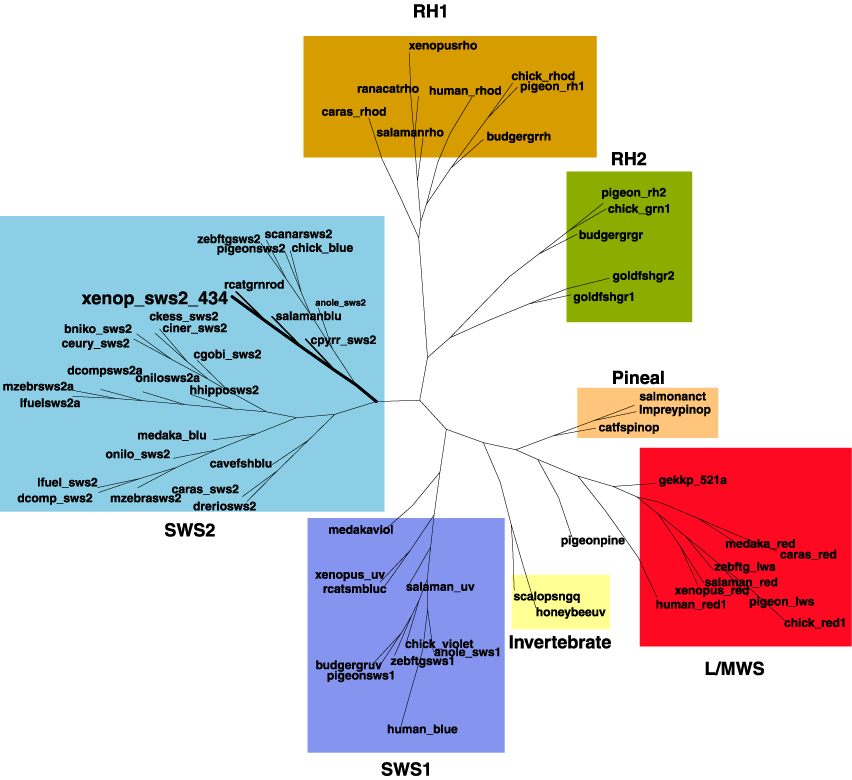
Figure 3. Xenopus SWS2, P434 phylogenetic tree analysis
Phylogenetic tree analysis of Xenopus SWS2, P434 opsin. A protein distance, phylogenetic tree of visual pigments was constructed as described in the Methods Section. This tree shows representative sequences in the RH1, RH2, SWS1, SWS2, L/MWS, pineal and invertebrate branches. The SWS2 branch, which includes the Xenopus P434 opsin, is unequivocally supported by independent bootstrap procedures (for details see the Methods Section). Many of the branches of the tree, and the associated species labels, have been deleted from the image for clarity. More information on the 92 opsin peptides is listed in Table 1.
