![]() Figure 5 of
Perkins, Mol Vis 2003;
9:60-73.
Figure 5 of
Perkins, Mol Vis 2003;
9:60-73.
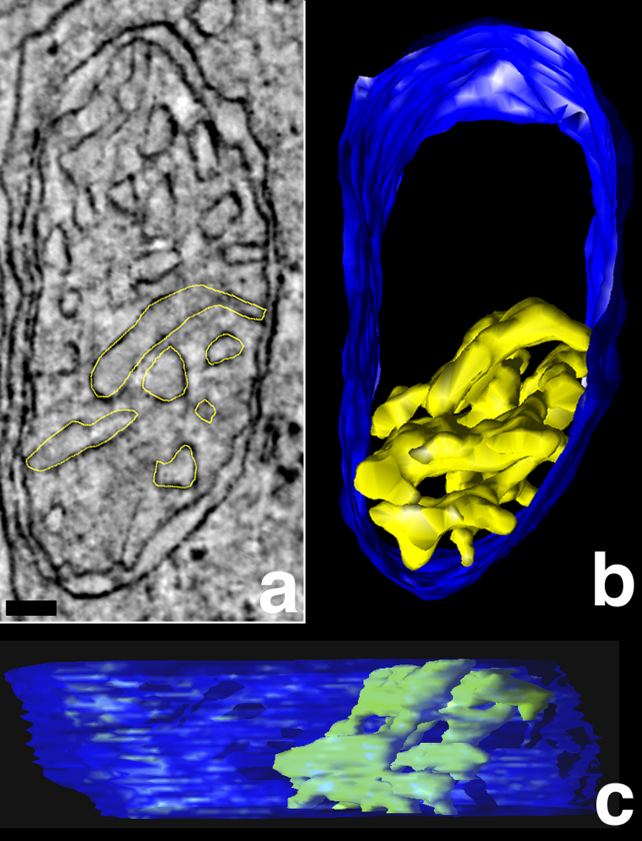
Figure 5. Rod mitochondria have both tubular and lamellar cristae segments
A: Slice through a rod mitochondrion reconstructed in 3-D. A similar analysis as conducted with cone mitochondria (Figure 4) was performed with rod mitochondria. A 3-D analysis is needed to determine which membrane profiles are separate cristae and which profiles represent slices through branches of the same crista. The yellow tracings highlight the branches of the largest crista in this slice through the rod mitochondrial volume. Note that four branches have a tubular profile, whereas two branches have a lamellar profile. Scale bar represents 50 nm. B and C: Perpendicular views after segmentation of the crista. The crista, traced in A, is shown in yellow and the outer membrane is shown in blue. This largest crista measured in rod mitochondria has a volume of 51,000 nm3, which represents approximately 7% of the entire mitochondrial volume, and has an inner membrane surface area of 170,000 nm2, which is equivalent to 51% of its total outer membrane surface area. Note that these values are considerably smaller than those for the largest crista measured in a cone mitochondrion (Figure 4). Hence, rod mitochondria possess moderate crista connectivity as opposed to the rather high connectivity measured in cone mitochondria.