![]() Figure 2 of
Rengarajan, Mol Vis 2002;
8:416-421.
Figure 2 of
Rengarajan, Mol Vis 2002;
8:416-421.
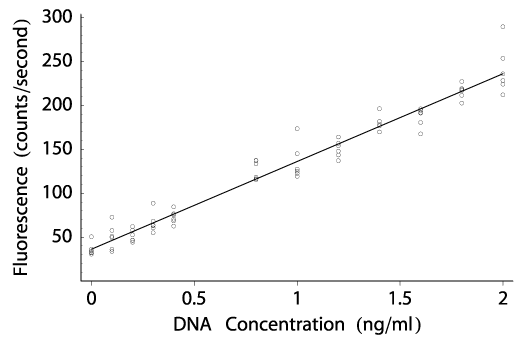
Figure 2. Measurement of low concentrations of DNA (0-2 ng/ml)
The graphs show the observed data with the linear regression models for the relationship between DNA concentration and observed fluorescence enhancement. Statistical analysis confirms the validity of the models for PicoGreen and SYBR Green I and suggests that PicoGreen can distinguish smaller differences in DNA concentration in this range (Table 2B). The models for ethidium bromide and Hoechst 33258 are not valid in this range. A: Ethidium bromide. B: Hoechst 33258. C: PicoGreen. D: SYBR Green I.
A:
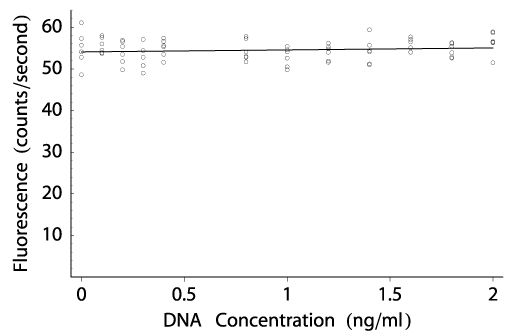
B:
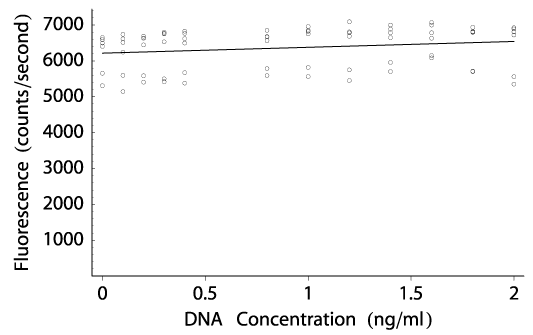
C:
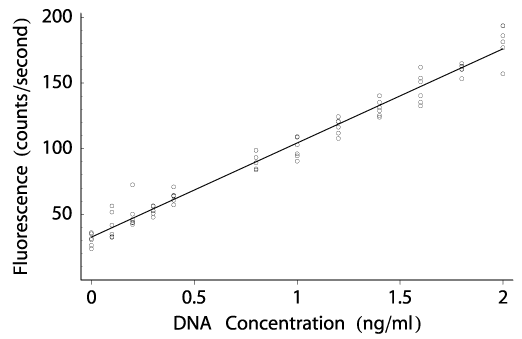
D: