![]() Figure 3 of
Lampi, Mol Vis 2002;
8:359-366.
Figure 3 of
Lampi, Mol Vis 2002;
8:359-366.
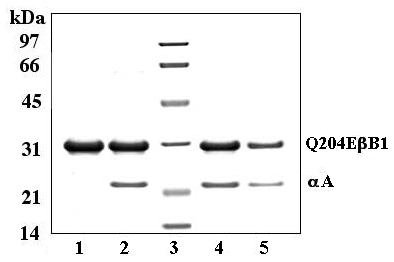
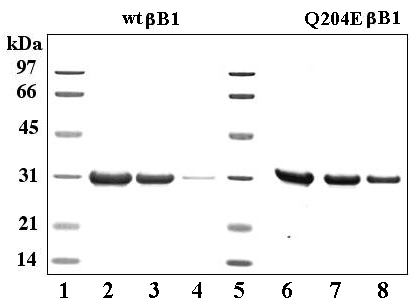
Figure 3. SDS-PAGE of βB1 samples from Figure 4
SDS-PAGE of wt βB1 and Q204E βB1 samples from Figure 4. A: Soluble and precipitated proteins were separated by centrifugation after heating for 180 min. Lanes 1 and 5 show molecular weight markers. Lanes 2 and 6 show wt βB1 and Q204E βB1 before heating. Lanes 3 and 7 show soluble wt βB1 and Q204E βB1. Lanes 4 and 8 show precipitated wt βB1 and Q204EβB1. B: Soluble and precipitated Q204E βB1 after heating in the presence of αA. Lanes 1 and 4 show soluble Q204E βB1 and αA after heating at equal molar concentrations (lane 1) and a 1:2 ratio of Q204E βB1 to αA (lane 4). Lanes 2 and 5 show precipitated Q204E βB1 and αA after heating at equal molar concentrations (lane 2) and 1:2 ratio of Q204E βB1 to αA (lane 5). Lane 3 shows molecular weight markers.
A:
B: