![]() Figure 3 of
Boyle, Mol Vis 2002;
8:226-234.
Figure 3 of
Boyle, Mol Vis 2002;
8:226-234.
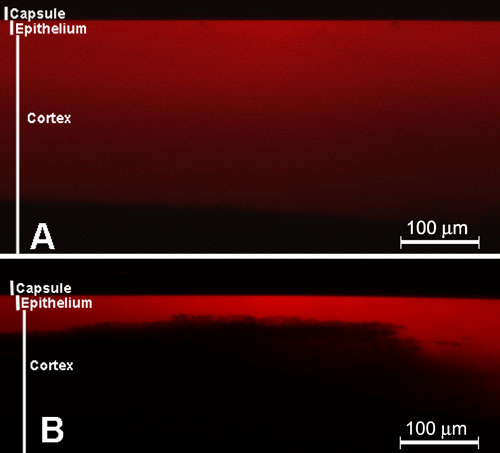
Figure 3. Z-scan confocal analysis of fluorescence
At 290 min incubation of α-crystallin, a z-scan was taken at right angles to the center of the field seen in Figure 1. Thickness of capsule and location of epithelium are designated. A: α-Crystallins without encapsulation. B: α-Crystallins with prior encapsulation using BioPORTER liposomes.