![]() Figure 2 of
Boyle, Mol Vis 2002;
8:226-234.
Figure 2 of
Boyle, Mol Vis 2002;
8:226-234.
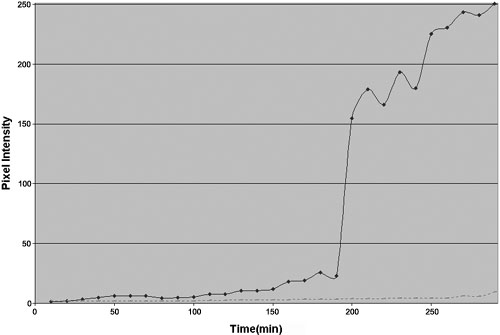
Figure 2. Quantitation of α-crystallin internalization
Quantization of fluorescence intensity in the epithelium of Texas red labeled α-crystallins, without (dotted line) or with (solid line) prior encapsulation using BioPORTER liposomes. The total pixel intensities of each panel in Figure 1 were determined, then plotted as a function of time of incubation.