![]() Figure 5 of
Yu, Mol Vis 2001;
7:48-56.
Figure 5 of
Yu, Mol Vis 2001;
7:48-56.
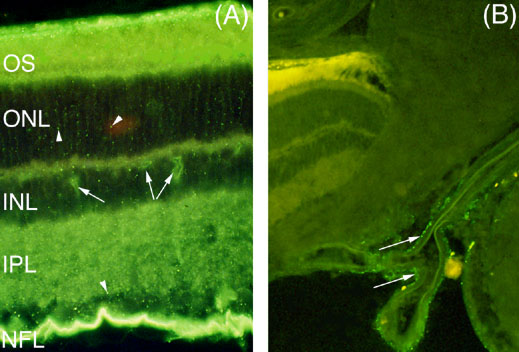
Figure 5. Epifluorescence micrographs of two regions of the retina from one eye at 6 h after an intravitreal injection of fl-Hsc/Hsp70
A: This image of the retina about midway between the optic nerve and ora serrata shows the higher level of uptake of fl-Hsc/Hsp70 seen at six h post-injection compared to one h (Figure 3). The pattern of uptake, however, is similar to that seen at one h, with the brightest fluorescence seen in the neuropil layers of the retina, the NFL, IPL, and outer plexiform layer (not labeled, but seen as a thin layer of fluorescence above the INL). Relatively little fluorescence was observed in the nuclear layers, the ganglion cell layer (the thin, dark band just above the NFL), INL, and ONL. In this case, the NFL fluorescence was extremely bright, and the OS (including the inner segment layer just below) was clearly green in color, rather than the yellow typical of autofluorescence, suggesting that fl-Hsc/Hsp70 was present in high levels there as well. Vesicular accumulations of fl-Hsc/Hsp70 are seen in all retinal layers (arrowheads indicate examples) and uptake was also obvious in capillary walls (arrows). B: In the optic nerve (ON) region of the same retina as in Panel A, there was less fl-Hsc/Hsp70 present, except in perivascular elements seen around the major ophthalmic blood vessel. Note also that the outer segment layer seen in the upper left here shows the yellow color of autofluorescence, in contrast to the green fluorescence in the OS in Panel A. 50x magnification. n=11.