![]() Figure 2 of
Rohrer, Mol Vis 2001;
7:288-296.
Figure 2 of
Rohrer, Mol Vis 2001;
7:288-296.
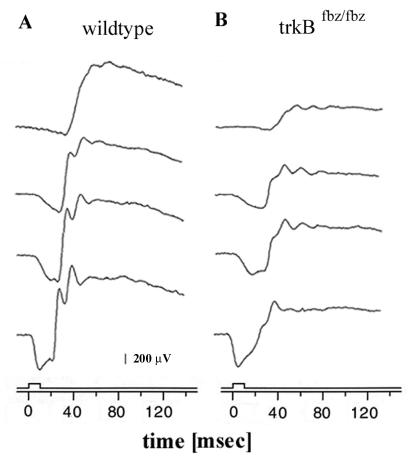
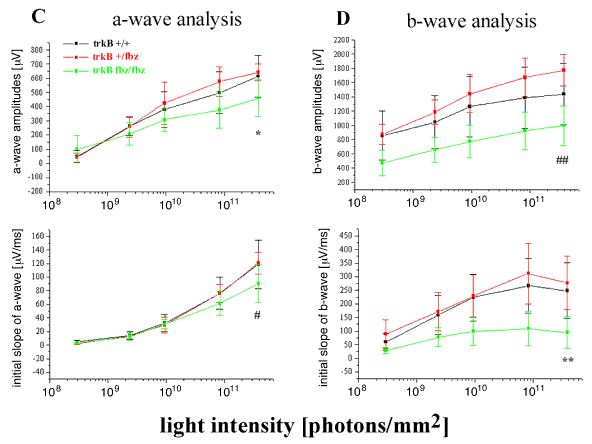
Figure 2. Electroretinogram responses from wild type (WT) and hypomorphic (trkBfbz/fbz) mice
Electroretinogram responses were elicited by short light flashes of increasing light intensities from P20 WT and trkBfbz/fbz mice. In the P20 WT (A), the electroretinogram consists of the negative a-wave, which is clipped by the fast positive b-wave and the overlying oscillatory potentials. The trkBfbz/fbz (B) photoreceptor responses (a-wave) are somewhat smaller and slower than the WT control responses (C); but more importantly, they elicit a rod bipolar cell driven b-wave characterized by a slower onset time and a significantly reduced amplitude (D).
Light intensities in A and B were 2.37x10⁹, 9.42x10⁹, 8.32x10¹⁰ and 3.85x10¹¹ photons/mm2 as measured at the level of the cornea. p values: *p<0.01; **p<0.005; #p<0.06; ##p<0.003. For additional statistical analyses refer to Table 1.

