![]() Figure 8 of
Gilliland, Mol Vis 2001;
7:120-130.
Figure 8 of
Gilliland, Mol Vis 2001;
7:120-130.
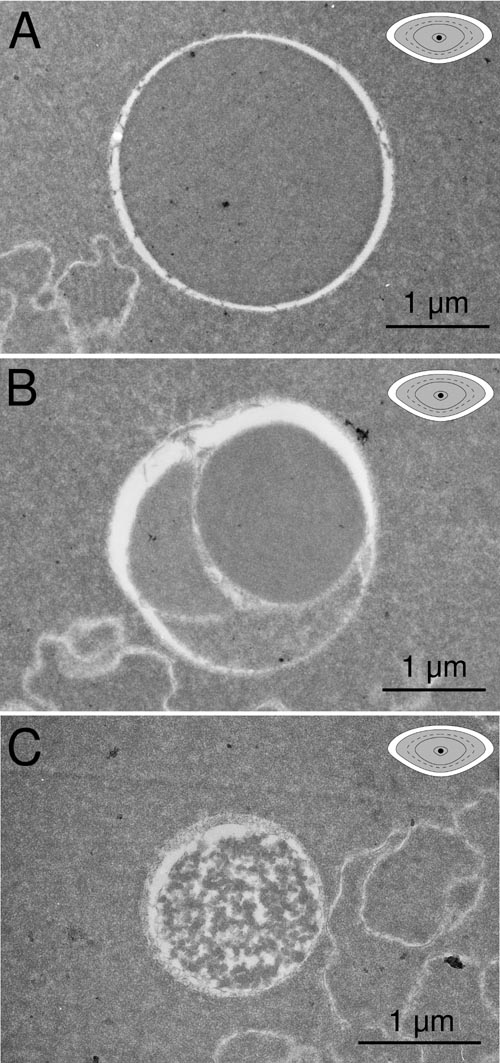
Figure 8. Gallery of transmission electron micrographs
TEMs are consistent with light micrographs. At about 20,000 times magnification, MLBs display variable cytoplasmic textures and unusual geometric patterns. A: Circular profile of an MLB with an interior that is smoother than the surrounding cytoplasm. B: Complex MLB with three domains, each with a different stain density and texture. C: A circular profile containing an irregular network of highly condensed strands. In the upper right corner of each image is a gray lens locator diagram which contains a black dot to indicate which developmental region of the lens (see Figure 1B) is shown in the micrograph.