![]() Figure 11 of
Gilliland, Mol Vis 2001;
7:120-130.
Figure 11 of
Gilliland, Mol Vis 2001;
7:120-130.
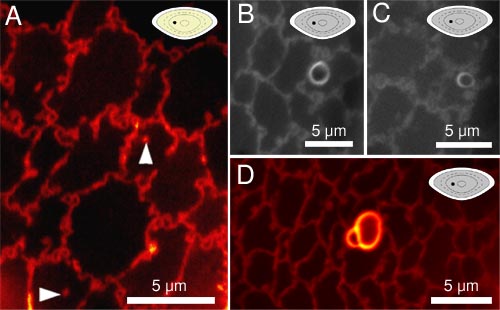
Figure 11. Comparison of normal and cataractous lenses
MLBs can be seen in cataractous tissue by laser scanning confocal microscopy using the lipid dye, DiI. Optical sectioning reveals lipid structures (B-D) of the same size and morphology as those examined by light and transmission electron microscopy, while the normal lenses typically contained no MLBs (A). Circular profiles (arrowheads in A) are distinguished from the obvious MLBs in B-D. In the upper right corner of each image is a lens locator diagram (yellow for a normal lens and gray for a cataract) which contains a black dot to indicate which developmental region of the lens (see Figure 1B) is shown in the micrograph.