![]() Figure 7 of
Gendron, Mol Vis 2001;
7:107-113.
Figure 7 of
Gendron, Mol Vis 2001;
7:107-113.
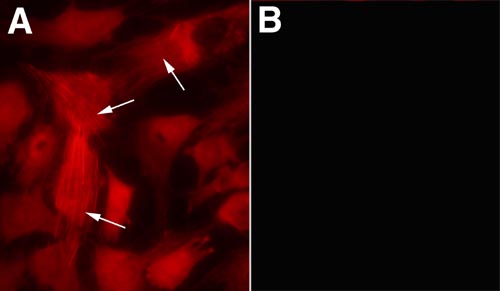
Figure 7. Immunocytochemical analysis of the induction of a-smooth muscle actin expression
Immunocytochemistry was performed with MK/T-1 cells using the same monoclonal antibody to a-smooth muscle actin (as used for western blotting in Figure 6) and fluorescent (rhodamine) conjugated anti-mouse second antibody. MK/T-1 cells expressed very low levels of a-smooth muscle actin after 24 h of culture (B), while MK/T-1 cultures treated for 24 h with TGF-b2 showed a significant increase in the numbers of cells expressing a-smooth muscle actin and the intensity of the actin signal (A). The TGF-b2 treated cultures also showed a change to a more spread out morphology consistent with reorganization of the cytoskeleton.