![]() Figure 3 of
Zhang, Mol Vis 2001;
7:1-5.
Figure 3 of
Zhang, Mol Vis 2001;
7:1-5.
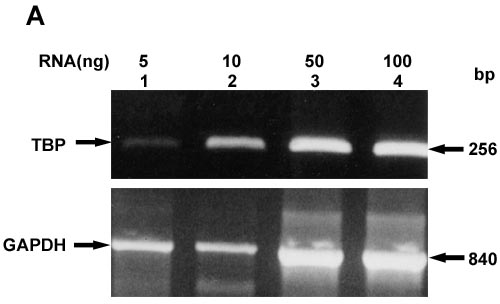
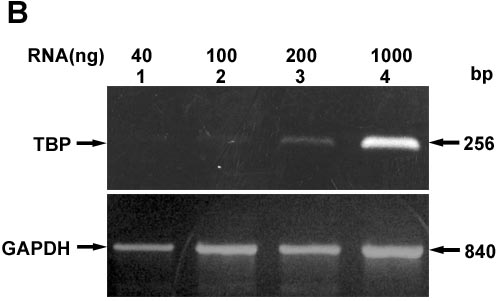
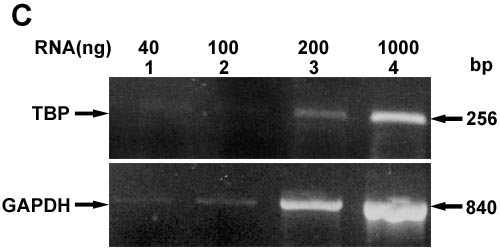
Figure 3. Relative levels of TBP
Relative levels of TBP in (A) lens epithelia, (B) lens fibers, and (C) whole lens total RNA preparations. Ethidium bromide stained gels showing the levels of TBP relative to GAPDH control transcript with indicated amounts of RNA. Also shown are the positions of TBP and GAPDH transcripts.