![]() Figure 2 of
Zhang, Mol Vis 2001;
7:1-5.
Figure 2 of
Zhang, Mol Vis 2001;
7:1-5.
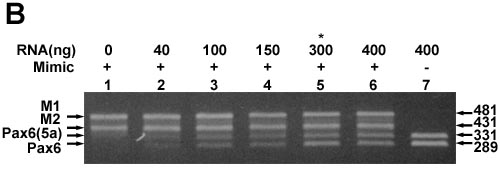
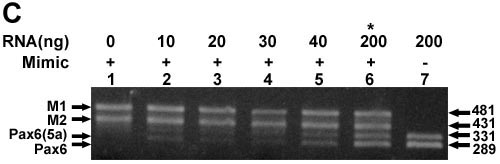
Figure 2. Quantitation of PAX6 and PAX6(5a) transcripts
Quantitation of PAX6 and PAX6(5a) transcripts in (A) lens epithelia, (B) lens fibers, and (C) whole lens RNA preparations. Ethidium bromide stained gels showing the levels of PAX6 and PAX6(5a) indicated transcripts using increasing amounts of total RNAs. Also indicated are the RNA and mimic DNA concentrations and the positions of the M1 (PAX6(5a) mimic), M2 (PAX6 mimic), PAX6(5a), and PAX6 products. Asterisks indicate amounts of RNA that equally compete with 0.13 pg of mimic DNAs.