![]() Figure 7 of
Gross, Mol Vis 2000;
6:51-62.
Figure 7 of
Gross, Mol Vis 2000;
6:51-62.
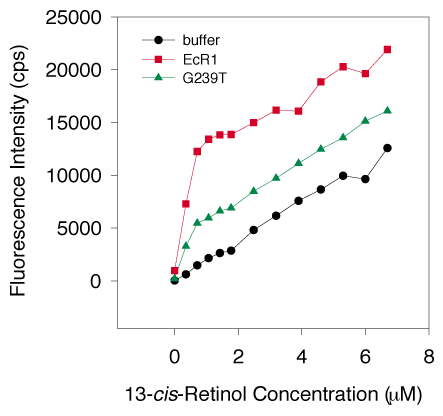
Figure 7. 13-cis-Retinol fluorescence enhancement
Three different G239T preparations (1 mM each in concentration, average shown by the green triangles) and an EcR1 preparation (1 mM in concentration, red squares) were titrated with 13-cis-retinol and the fluorescence enhancement was measured by excitation at 338 nm and emission at 492 nm. 13-cis-Retinol added to buffer alone (black circles) showed a gradual linear increase in fluorescence similar in magnitude to that observed with all-trans-retinol (Figure 6), while EcR1 revealed a rapid increase to about 12,000 cps from 0 to 1 mM total retinol concentration indicative of a high affinity interaction between retinol and the protein. The EcR1-retinol complex paralleled the slope of the ligand alone line (black circles) beyond 1 mM ligand concentration, suggesting saturation. G239T exhibited the same high affinity and saturable interaction with 13-cis-retinol, but the intensity of the fluorescence enhancement was about 3-fold less.
