![]() Figure 6 of
Gross, Mol Vis 2000;
6:51-62.
Figure 6 of
Gross, Mol Vis 2000;
6:51-62.
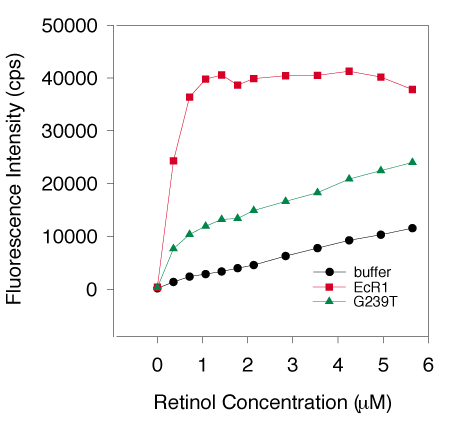
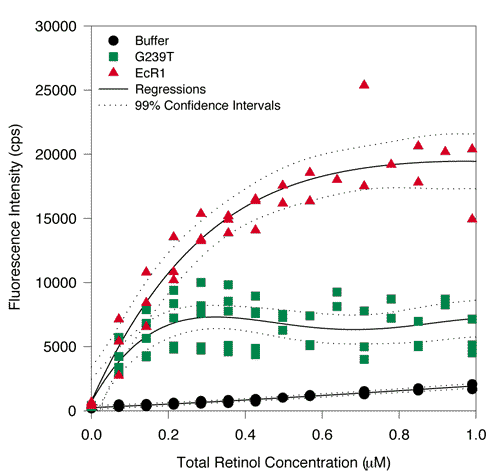
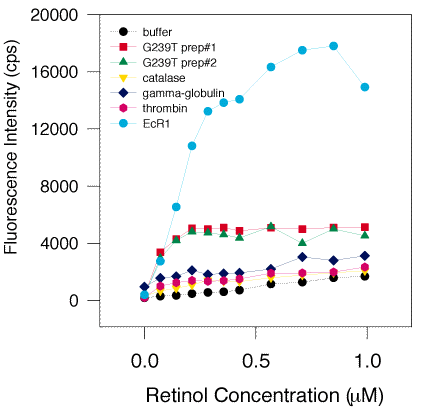
Figure 6. Retinol fluorescence enhancement by G239T and EcR1
A. Typical titrations of EcR1 and G239T.
Four separate G239T preparations and a single EcR1 protein preparation (1 mM each) were titrated with all-trans-retinol and the fluorescence enhancement of retinol was measured as described previously [15-17]. Ligand added to buffer alone (black circles) showed a gradual linear increase in fluorescence, while EcR1 (red squares) revealed a rapid increase of 40,000 cps from 0 to 1.5 mM total retinol concentration, indicative of a high affinity interaction of retinol and the protein. EcR1 plateaued beyond 1.5 mM ligand concentration suggesting saturation. The four preparations of G239T (average shown by the green triangles) exhibited a similar high affinity and saturable interaction with retinol, but the intensity of the fluorescence enhancement was about 3-fold less.

B. Typical titrations in the submicromolar range.
Three separate G239T preparations (1 mM each) were titrated five times and two EcR1 protein preparations were titrated three times with all-trans-retinol between 0 and 1 mM. A regression was carried out and the black lines indicate the fitted curves. 99% confidence intervals are shown on either side of each curve by the dotted black lines. Free retinol fluorescence is shown by the black circles. The fluorescence of the mixture of retinol and G239T is indicated by the green squares. The fluorescence intensity of EcR1 mixed with retinol is shown by the red triangles. G239T clearly exhibited fluorescence in excess of the buffer control at all concentrations of retinol greater than zero. However, the fluorescence of G239T was not as substantial as EcR1 at concentrations greater than 0.1 mM total ligand concentration.

C. Demonstration of specific binding by G239T and EcR1 and no binding by control proteins.
Two preparations of G239T (green triangles and red squares), EcR1 (light blue circles), catalase (yellow down-pointing triangles), g-globulin (dark blue diamonds), and thrombin (violet hexagons, 1 mM solutions) were titrated with retinol from 0 to 1 mM and the fluorescence measured. Representative titrations are shown. Specific binding is defined as a sizable increase in the fluorescence response at low concentration that is saturable, reaching a plateau or paralleling the ligand alone (buffer, black circles). Specific binding was shown with EcR1 by its rapid increase (about 10 times the rate of increase) over retinol alone at low concentrations, in the range of 0 to 0.4 mM, and saturation by its paralleling retinol alone at higher concentration. Likewise, G239T manifested specific binding of retinol by this assay, though showing a lesser enhancement of 2-3 fold over retinol alone. No fluorescence enhancement was detected with catalase, g-globulin, or thrombin, suggesting that these proteins lack a binding site for retinol and cannot specifically bind this ligand.
