![]() Figure 6 of
Hamer, Mol Vis 2000;
6:265-286.
Figure 6 of
Hamer, Mol Vis 2000;
6:265-286.
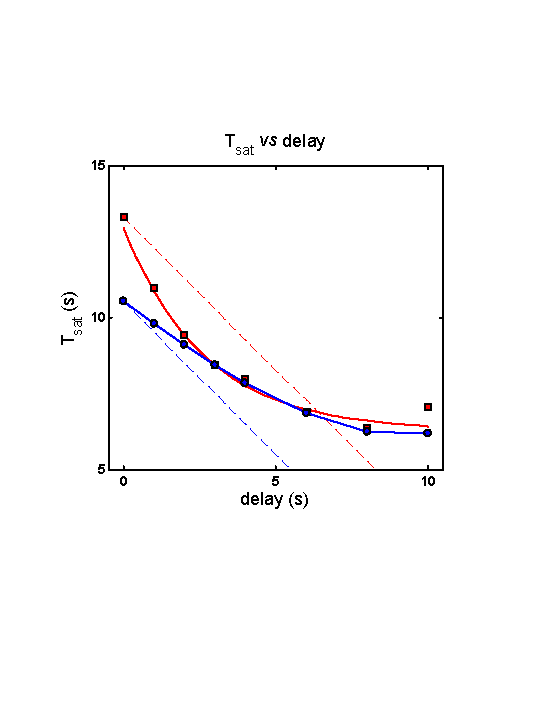
Figure 6. RecRK model does not account for Murnick & Lamb data with τR rate-limiting
With τR rate-limiting in the RecRK model, the reduction in model Testflash Tsat (blue curve) cannot exceed the magnitude of the delay between Pre- and Test flashes; i.e., the model results are always above the dashed blue line with slope -1. This contrasts with the Murnick & Lamb data (red curve versus red dashed line). This failure rules out a model structure in which R* lifetime is rate-limiting and in which early Ca++ feedback occurs solely at R* lifetime (via RecRK; [1]).
