![]() Figure 12 of
Hamer, Mol Vis 2000;
6:265-286.
Figure 12 of
Hamer, Mol Vis 2000;
6:265-286.
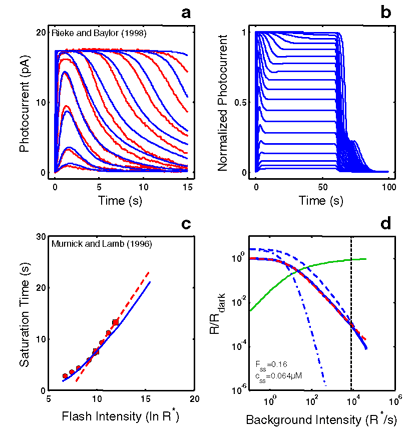
Figure 12. An R* activation model with τR rate-limiting accounts for the Empirical Response Suite I
A: The model provides a reasonable fit to the sub-saturating flash responses. B-D: With the same parameters, the model also accounts for the signature features of step responses (B), Tsat versus ln(I) (C), and generates a relatively large range of LA flash sensitivity adhering to Weber's law (D).
