![]() Figure 5 of
Grimm, Mol Vis 2000;
6:252-260.
Figure 5 of
Grimm, Mol Vis 2000;
6:252-260.
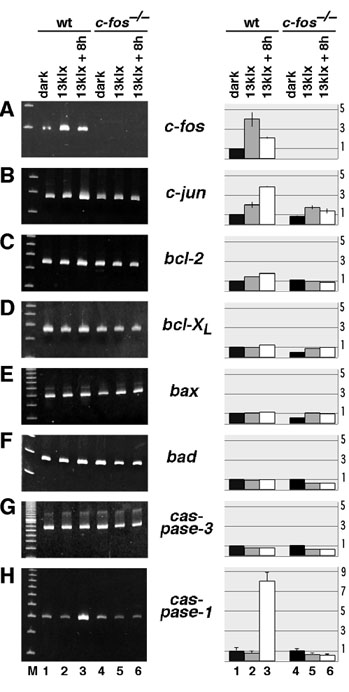
Figure 5. Gene expression in wildtype and c-fos-/- mice
Relative levels of indicated RNAs (A through H) in retinas of 129SV/Bl6 wildtype (lanes 1 through 3) and 129SV/Bl6 c-fos-/- mice (lanes 4 through 6) as determined by exponential RT-PCR. Panels on the left: example amplifications with the respective primer pairs. Lanes 1 and 4: unexposed controls. Lanes 2 and 5: Exposed to 13,000 lux (13 klux) for 120 min. Lanes 3 and 6: Exposed to 13 klux for 120 min with a subsequent recovery period of 8 h in darkness. Panels on the right: Relative levels of the respective RNAs. Black bars: unexposed controls. Grey bars: relative RNA levels after exposure to 13 klux for 120 min. White bars: relative RNA levels after exposure to 13 klux for 120 min and a subsequent recovery period of 8 h in darkness. RNA levels of unexposed 129SV/Bl6 wildtype mice (shown in lane 1) were set as 1. Amplifications were done once (C, F), twice (A, B, D, E, G) or four times (H). The ranges of the two individual amplification values (A, B, D, E, G) are shown whenever the range exceeded a value of 0.2. Standard deviations (H; bars) are indicated. RNAs were isolated from one retina per timepoint and condition. Second independent experiments with other groups of mice are shown in Figure 2 and Figure 3.