![]() Figure 2 of
Grimm, Mol Vis 2000;
6:252-260.
Figure 2 of
Grimm, Mol Vis 2000;
6:252-260.
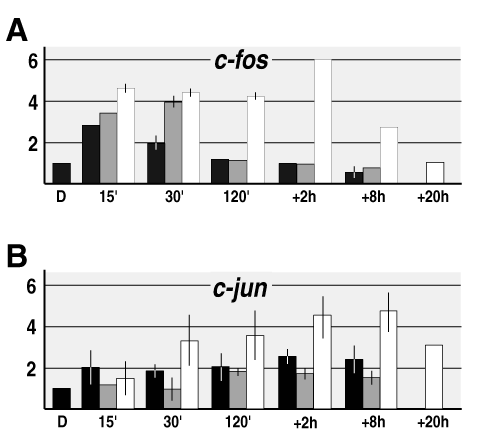
Figure 2. Retina levels of c-fos and c-jun mRNA
Analysis of c-fos and c-jun mRNA levels in retinas of 129SV/Bl6 mice by RT-PCR. A: Bar diagram of relative levels of c-fos RNA as estimated by competitive RT-PCR. B: Bar diagram of relative c-jun RNA levels as estimated by exponential RT-PCR. Mice with dilated pupils were either kept in darkness (black bars) or exposed to 60 lux (grey bars) or to 13,000 lux (white bars) of white light for 15 min (15'), 30 min (30') or 120 min (120') or for 120 min with a subsequent recovery period in darkness of 2 h (+2h), 8h (+8h) or 20 h (+20h) as indicated. Average values of two amplification reactions of RNA isolated from one retina per timepoint and condition are shown. The ranges of the two individual amplification values are shown whenever the range exceeded a value of 0.3. Second independent experiments with another group of mice are shown in Figure 5.