![]() Figure 1 of
Marcus, Mol Vis 2000;
6:169-177.
Figure 1 of
Marcus, Mol Vis 2000;
6:169-177.
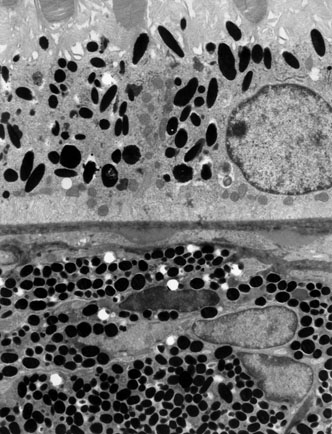
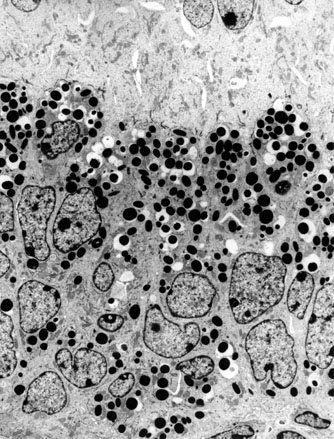
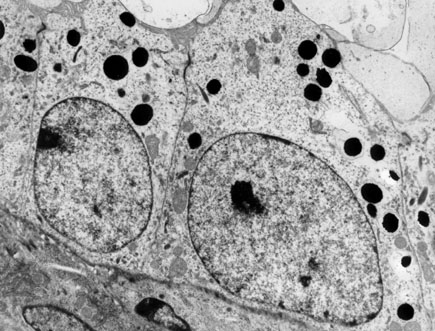
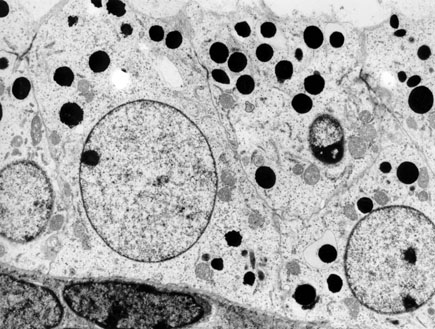
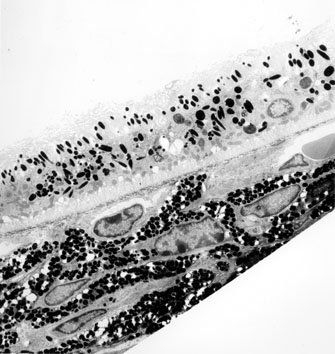
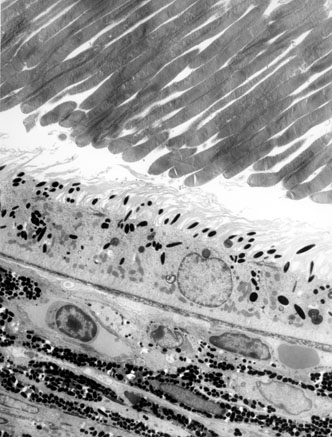
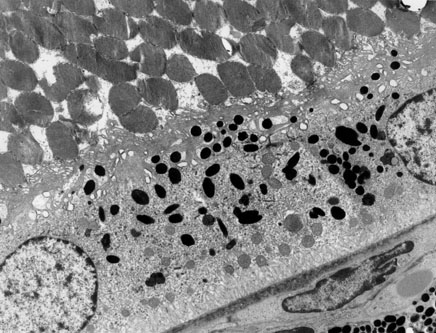
Figure 1. Ultrastructural features of APC-treated and normal mouse RPE
Panel A: Electron micrographs from embryonic day 18 APC 1638 mouse 3 demonstrating focal hyperplastic proliferation of the RPE with increased melanosomes. Panel B: Electron microscopic examination of a normal appearing region of the RPE by light microscopy from APC 1638 mouse 3 demonstrates no ultrastructural differences from a normal control mouse (mouse 1; panel C). Panel D: Electron micrographs from a 3 month old APC 1638 mouse (mouse 13) demonstrating atropic RPE with increased melanosome production compared to the (E) adjacent RPE from the same eye (Panel E). Panels F and G: Electron micrographs from four-month old APC 1638 mouse 15 (panel F) and control mouse 8 (panel G) demonstrating normal RPE and adjacent outer segments.
Magnifications: Panels A, D, and E, 1650x; Panels B, C, F, and G, 3550x
A.
B.
C.
D.
E.
F.
G.