![]() Figure 5 of
Cai, Mol Vis 2000;
6:132-143.
Figure 5 of
Cai, Mol Vis 2000;
6:132-143.
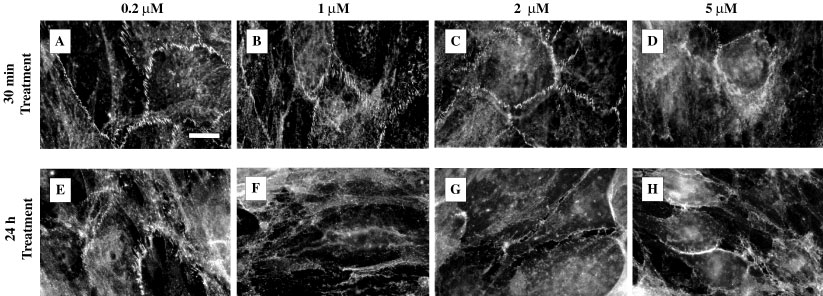
Figure 5. Effect of LAT-A on the distribution of b-catenin in HTM cells
Effect of 0.2, 1, 2, or 5 mM LAT-A for 30 min and 24 h on the distribution of b-catenin in cultured HTM cells. See Figure 3C for normal b-catenin distribution, and Figure 7 for b-catenin distribution after 2 h LAT-A treatment. LAT-A induced time- and dose-dependent disorganization and disruption of b-catenin-containing intercellular junctions. b-catenin staining appeared to be affected as early as 30 min after 1 mM LAT-A treatment. Within 24 h at the lowest LAT-A dose (0.2 mM), staining at cell-cell borders became irregular and often discontinuous (panel E). At higher doses, most cell-cell borders completely disappeared and some cells separated (panels F-H). Bar = 20 mm.