![]() Figure 2 of
Matsunaga, Mol Vis 1999;
5:39.
Figure 2 of
Matsunaga, Mol Vis 1999;
5:39.
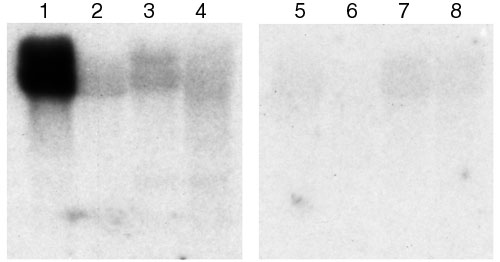
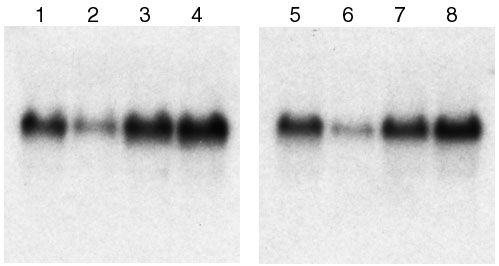
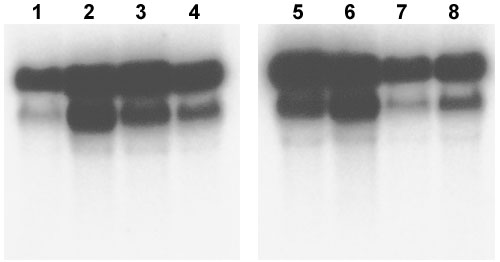
Figure 2. Northern blot analysis of selected genes
Young (PDL 25) and senescent (PDL 52) RPE cultures were analyzed at sparse and confluent density after growth in low and high serum, as outlined in the Methods section. Lanes 1-8 correspond to the order of lanes in Figure 1.
A. PEDF
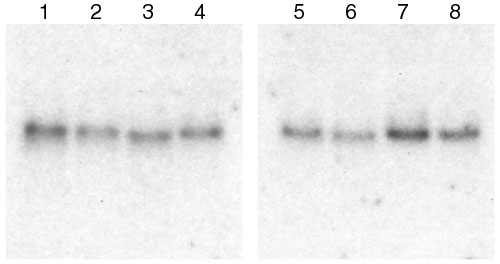
B. Perlecan
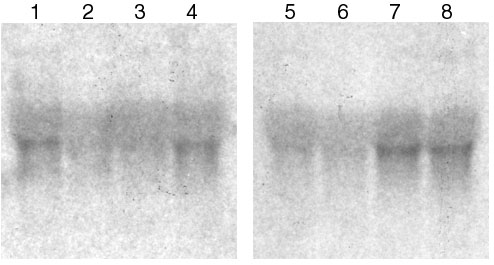
C. TIMP-3
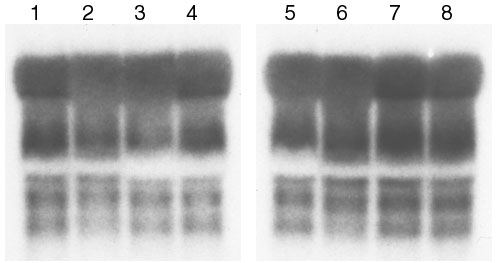
D. u-PA
E. PAI-1
F. Collagen I[alpha]2