![]() Figure 1 of
Matsunaga, Mol Vis 1999;
5:39.
Figure 1 of
Matsunaga, Mol Vis 1999;
5:39.
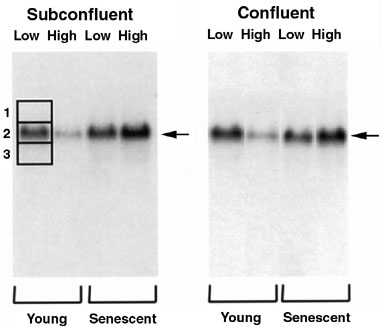
Figure 1. Northern blot analysis of u-PA
Young (PDL 25) and senescent (PDL 52) RPE cultures were analyzed at sparse and confluent density after growth in low (DMEM/F12 + 0.1% FBS) and high (DMEM/F12 + 10% FBS) serum, as outlined in the Methods section. Boxes 1 and 3 represent areas used to determine background counts which were subtracted from Box 2, the area of interest. Arrow indicates the band corresponding to u-PA.