![]() Figure 4 of
Park, Mol Vis 1999;
5:18.
Figure 4 of
Park, Mol Vis 1999;
5:18.
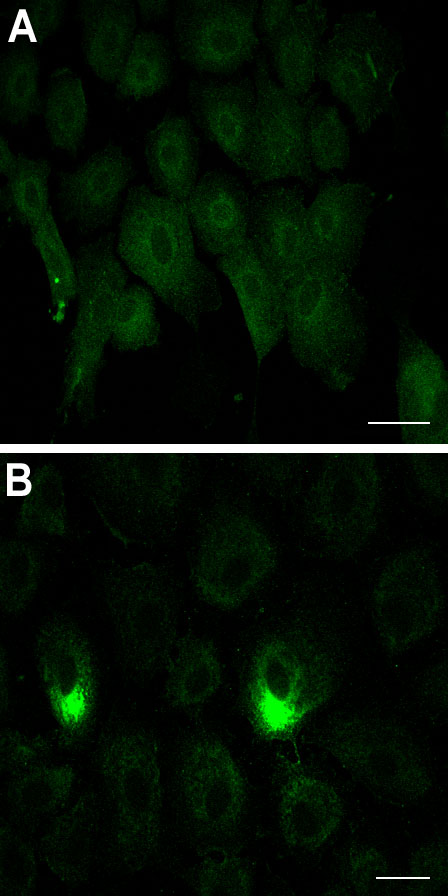
Figure 4. Subcellular localization of endogenous PLC-[gamma]1
Those cells that were not used for microinjection in Figure 3B (with FGF-2 stimulation) were shown here in A, while the cells maintained in the absence of FGF-2 in Figure 3A are shown here in B. The treatment and preparation for immunolocalization were described in the figure legend of Figure 3. The two cells in B were microinjected with GST-SH3. Data are representative of three microinjection experiments. Bar, A: 50 µm; B, 25 µm.